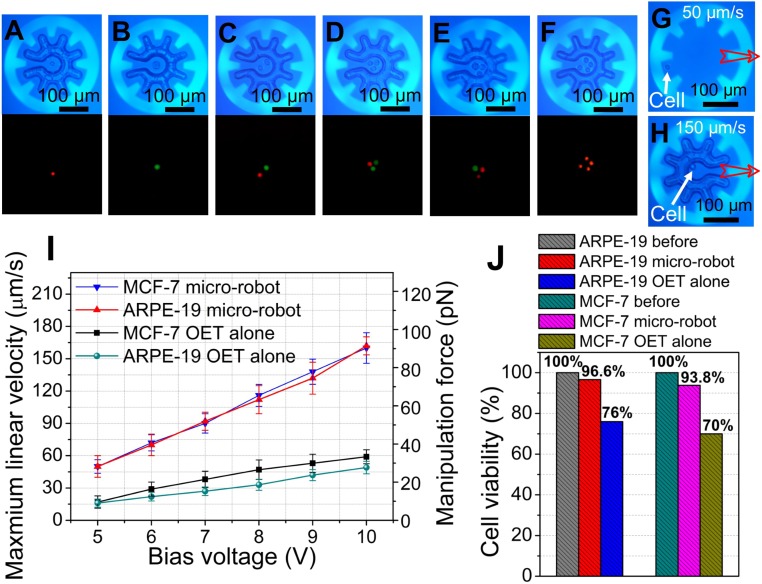
Fig. 3.
Microrobot manipulation of mammalian cells. (A–F) Bright-field (Top) and fluorescent (Bottom) microscope images (from Movie S6) of different combinations of ARPE-19 cells (prelabeled with red fluorescent dye) and MCF-7 cells (prelabeled with green fluorescent dye) after loading into microrobots. Bright-field microscope images (from Movie S7) depicting the manipulation of a single ARPE-19 cell with (G) OET alone at 50 μm/s and (H) a microrobot at 150 μm/s. Open red arrows represent translation. (I) Maximum linear velocity (left axis) and corresponding DEP manipulation force (right axis) as a function of bias voltage for individual ARPE-19 cells or MCF-7 cells translated by OET alone (turquoise circles or black squares, respectively) or by microrobot (red triangles or blue triangles, respectively). Error bars represent ±1 SD from 5 measurements. (J) Cell viability before (gray hatch: ARPE-19; turquoise hatch: MCF-7) and after cells were continuously manipulated at 15 μm/s for 100 s by OET alone (blue hatch: ARPE-19, n = 38/50; yellow hatch: MCF-7, n = 35/50) or a microrobot (red hatch: ARPE-19, n = 28/29; violet hatch: MCF-7, n = 30/32) at an applied bias of 7 Vp-p at 20 kHz. Numbers of cells evaluated in each condition (n) are pooled from 10 replicates of 5 cells each (for OET alone) and 10 replicates of 2 to 5 cells each (for the microrobot).

