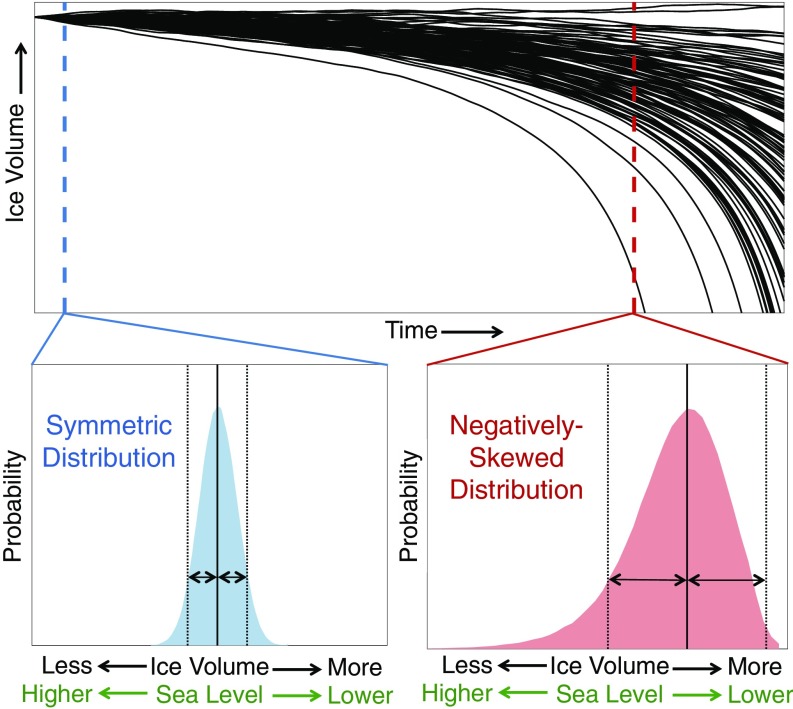
Fig. 1.
(Upper) Conceptual illustration of an evolving ensemble of ice sheet model simulations, where each solid line is a single plausible realization of the future ice sheet evolution. Dashed colored lines indicate two time slices, for which probability distributions are provided (Lower Left and Lower Right). The statistical properties of the probability distribution of ensemble simulations change with time from a narrow, symmetric distribution at early times (blue dashed line, Lower Left) to a wide, asymmetric distribution with negative skewness (red dashed line, Lower Right), making the probability of ice sheet volumes below the most likely projection many times greater than that of ice sheet volumes above the most likely projection (arrows show example of ice sheet volumes above and below the most likely ice sheet volume projection).

