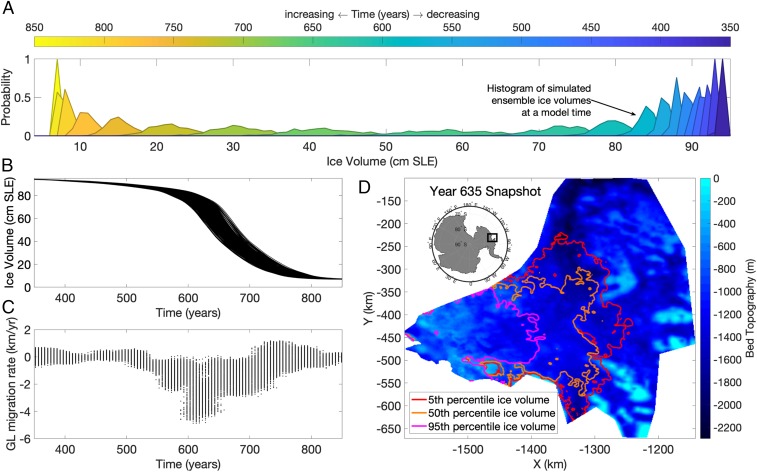
Fig. 3.
Evolution of a 500-member ensemble of ISSM simulations of Thwaites Glacier evolution over 500 y (where year 0 in model time is the modern glacier state) in response to decadal variability and constant average in maximum subice shelf melt rate. (A) Evolution of ensemble PDF over time, plotted every 25 y, with probability on the y axis and Thwaites Glacier ice volume (in cm sea-level equivalent [SLE]) on the x axis. (B) Black lines are simulated ice volume contained in Thwaites Glacier catchment in cm SLE for all ensemble members. (C) Black dots are evolving grounding-line migration rates for all ensemble members (based on the centroid of the 2D grounding line). (D) Snapshots (red, orange, and pink lines) of grounding-line positions at year 635 in model time, from 5th percentile, 50th percentile, and 95th percentile ice volume ensemble members.

