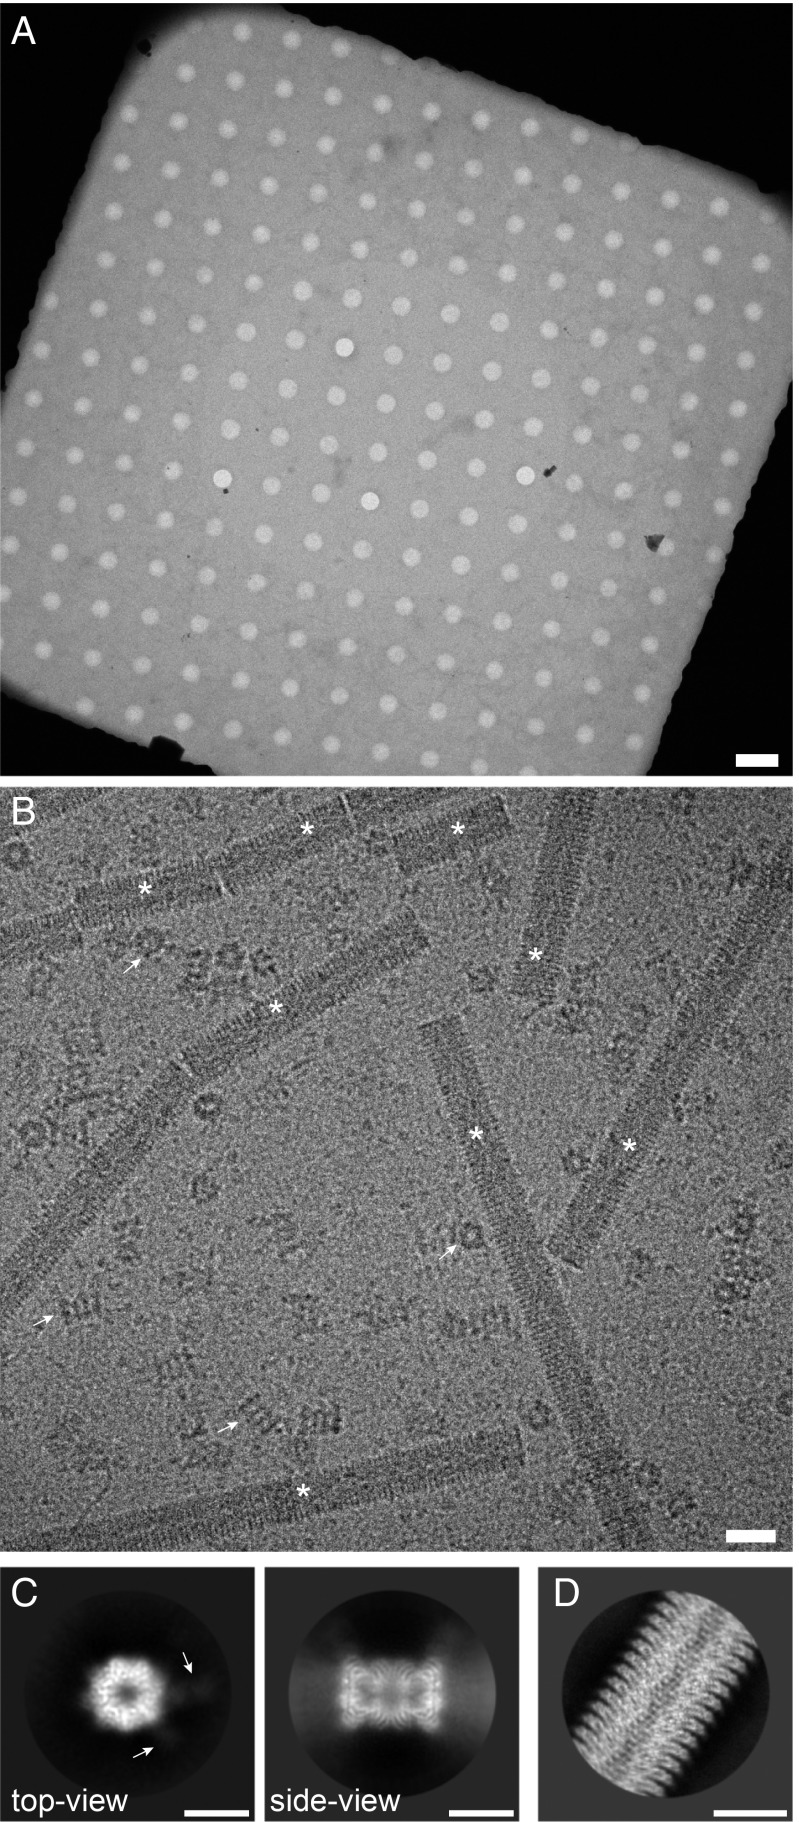
Fig. 2.
Sample quality and data collection. (A) Overview image of a grid square and the holey carbon film, showing a thin film of vitreous ice. (Scale bar: 4 m.) (B) High-magnification image of the isolated 20S proteasome sample. Arrows indicate 20S proteasome as top and side views; asterisks denote TMV. Furthermore, small particles are visible in the background, most probably unbound Fabs. (Scale bar: 20 nm.) TMV was added to the elution buffer as a positive control for the cryo-EM grid quality (SI Appendix, Fig. S4). The contrast of the image was increased using a Gaussian blur and subsequent histogram adjustment. (C) Selected projection averages of the 20S proteasome. Arrows indicate 2 bound Fabs recognizing the subunit. (Scale bar: 10 nm.) (D) Typical projection average of TMV from the same cryo-EM grid as the 20S proteasome. (Scale bar: 10 nm.)

