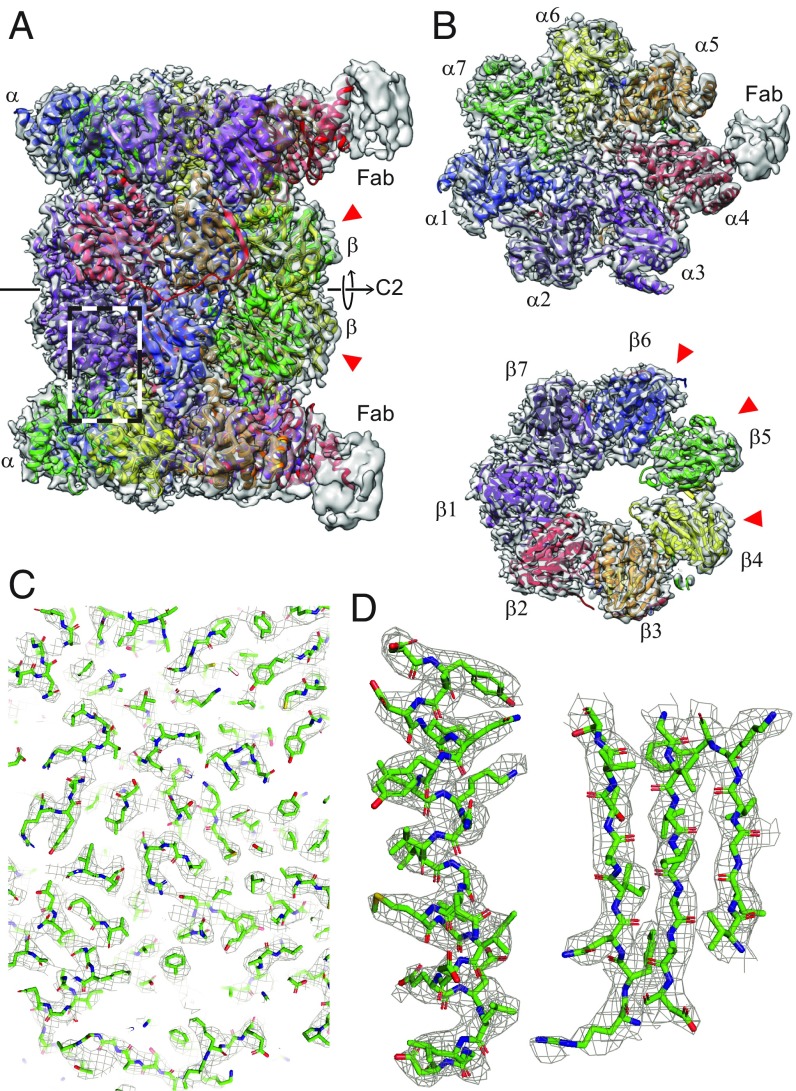
Fig. 3.
The 3D reconstruction of the human 20S proteasome. The red arrowheads indicate the catalytically active subunits. (A) Side view showing the 2 and 2 rings. All 14 subunits are fitted into the mass densities. Parts of the 2 bound Fabs are visible at lower resolution, due to the high flexibility of the attached Fabs. The C2 symmetry axis is indicated. (B) Top view of an and a ring. Both rings have a pseudo-7-fold symmetry. Different subunits are indicated by different colors. (C) A zoom-in into the side-view region indicated by the dashed box in A, documenting the quality of the data and model fitting. An enlarged view of 1 -helix and 3 strands of a -sheet is shown in D as an example.

