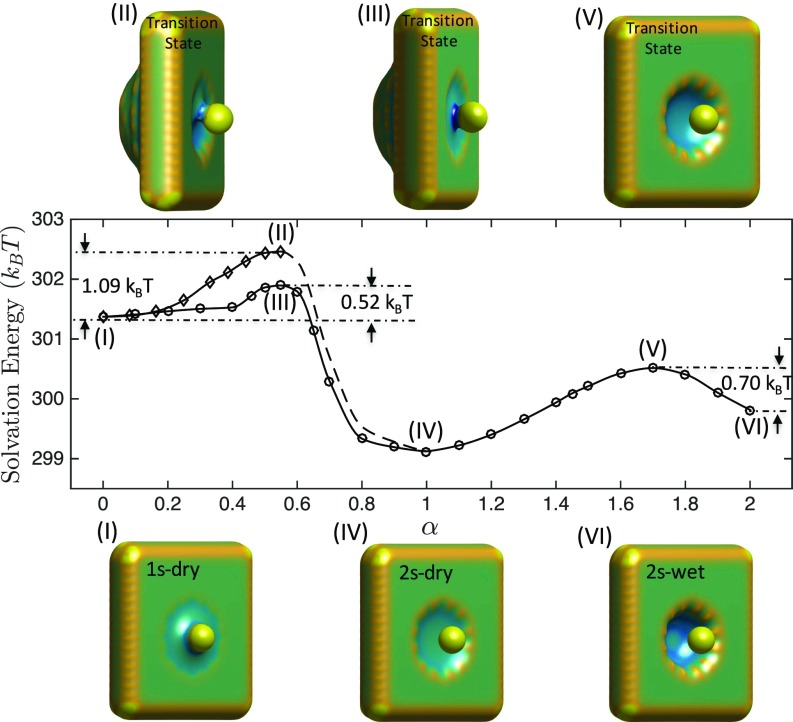
Fig. 3.
Solvation free energies of images on MEPs that connect the hydration states 1s-dry (I), 2s-dry (IV), and 2s-wet (VI) (shown at Bottom) with transition states (II), (III), and (V) (shown at Top) and the transition energy barriers for Å. In Middle plots, the horizontal axis is the string parameter .

