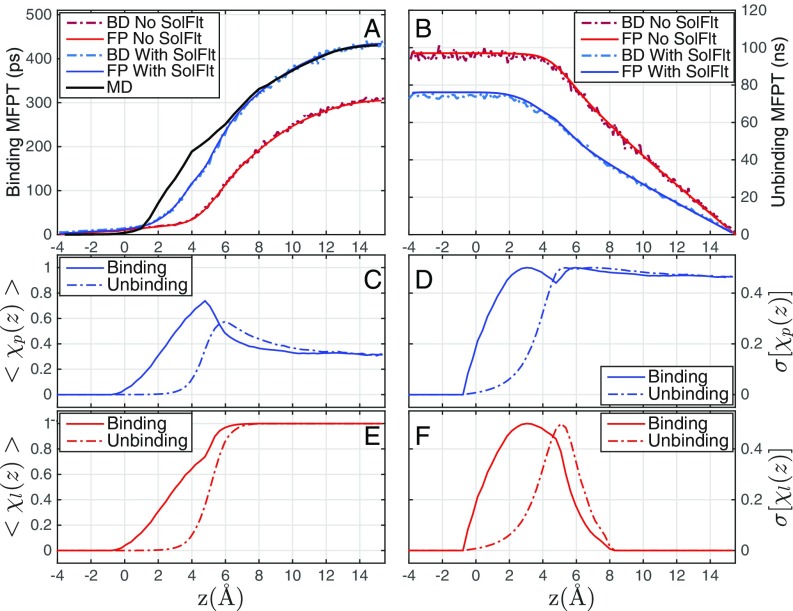
Fig. 5.
(A and B) The MFPT for (A) the binding of ligand that starts from and reaches the pocket at Å and (B) the unbinding of ligand that starts from and reaches Å, predicted by BD simulations without (BD No SolFlt) and with (BD With SolFlt) the dry–wet fluctuations, and FPE calculations without (FP No SolFlt) and with (FP With SolFlt) the dry–wet fluctuations, respectively. Note that the time unit on the vertical axis in B is nanoseconds (ns) while that in A is picoseconds (ps). The MFPT obtained by explicit-water MD simulations (MD) (18) is also shown in A. (C–F) The mean values and SDs of the pocket and ligand hydration states and , respectively, against the ligand location during the nonequilibrium binding process from the BD simulations starting at Å (C and E) and the unbinding process starting at Å (D and F).

