Fig. 1.
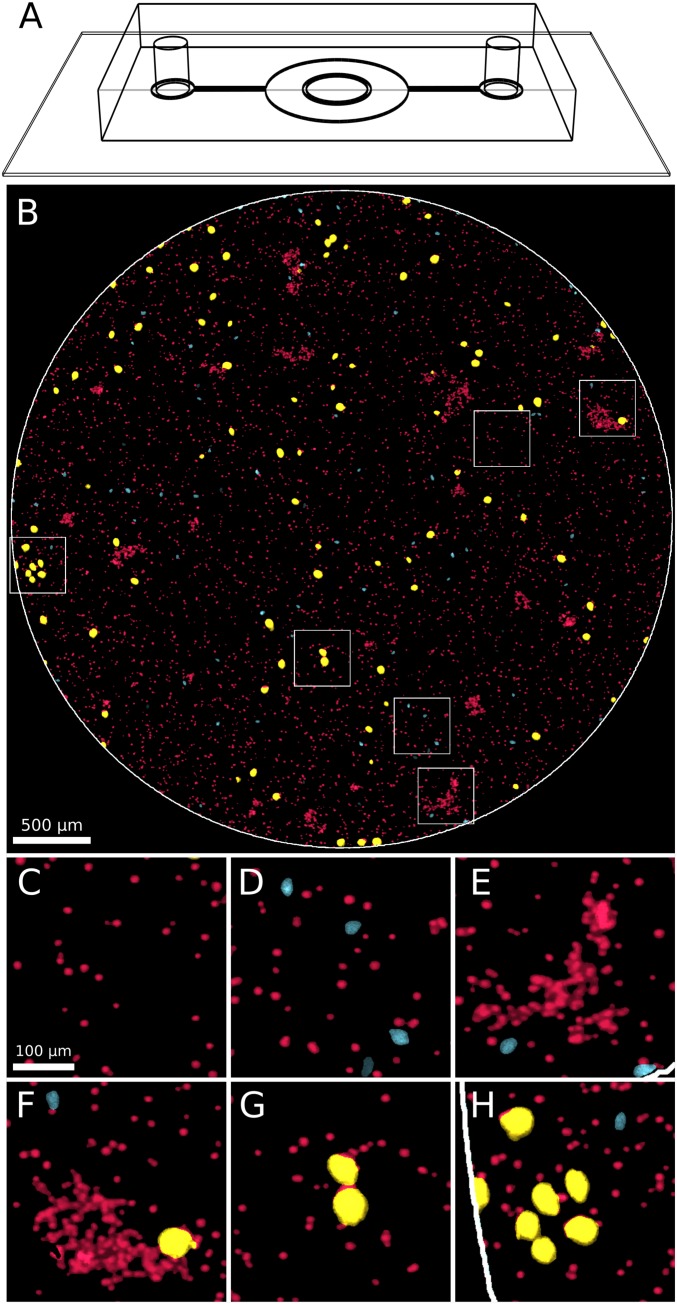
Week-long imaging of all cells of a ciliate/algae ecosystem in a microfluidic chamber. (A) Schematic drawing of the PDMS microfluidic chamber bonded to a glass coverslip. C. reinhardtii (Cr) and T. thermophila (Tt) cells trapped in the central circular chamber (4.3 mm in diameter and 110 m in depth) are time-lapse imaged in the custom-made fluorescent microscope (SI Appendix, Fig. S1). (B) Sample image showing the entire 4.3-mm chamber (white circle boundary) containing Cr and Tt cells. Cells are pseudocolored by class (Cr in red, s-Tt in cyan, and l-Tt in yellow) to improve contrast and facilitate distinguishability. (C–H) Six small -magnified subregions (corresponding to the white squares in B), showing Cr singlet cells, Cr clumps (E and F), s-Tt cells (smaller cyan cells in D, E, F, and H), and l-Tt cells (larger yellow cells in F–H).

