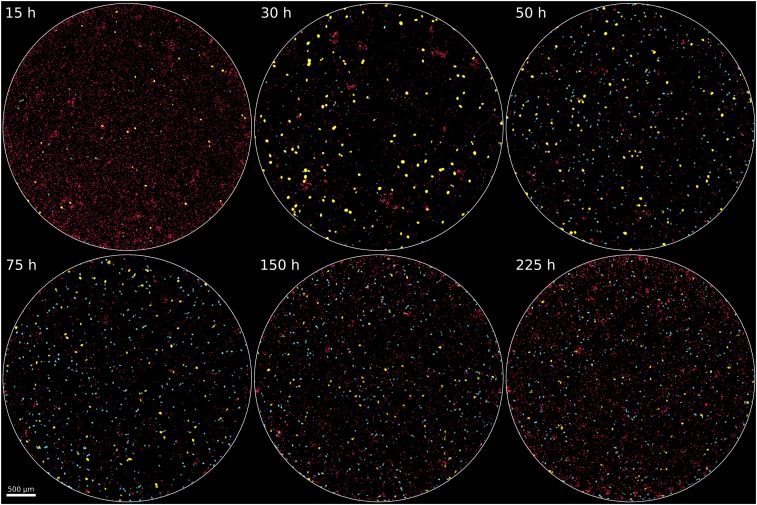
Fig. 2.
Whole-chamber time-lapse images from a single ecosystem. Six images from different times show overall changes in a replicate ecosystem. With regard to timing, there is a mix of many Cr (red cells) and some Tt (cyan and yellow cells) at 15 h, followed by the temporary increase in abundance of l-Tt (yellow cells) which phagocytose Cr cells at 30 h, leading to a large reduction in Cr by 50 h, followed by persistence of both Cr and Tt (mainly s-Tt; cyan cells) through 225 h. In other replicates, similar changes occur, but at different times (Figs. 3 and 5).

