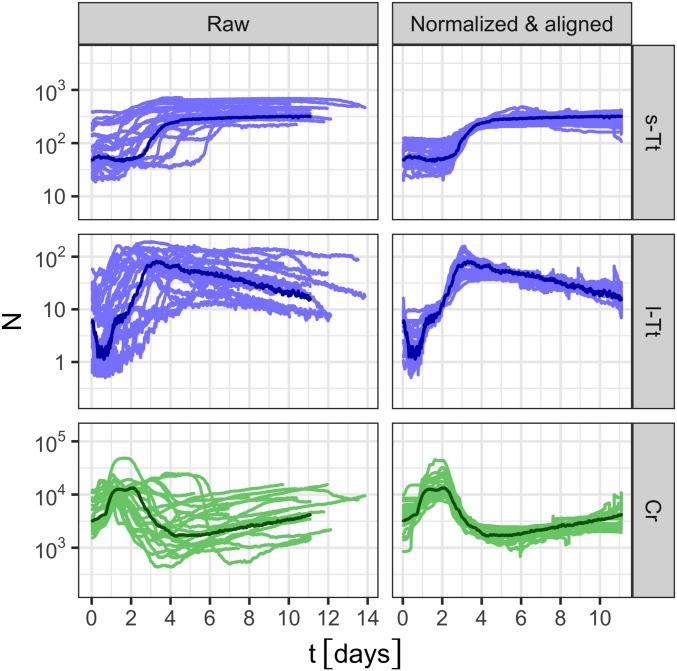
Fig. 3.
The abundances of each class of organism [Top, small T. thermophila (“s-Tt”); Middle, large T. thermophila (“l-Tt”); Bottom, C. reinhardtii (“Cr”)] from 23 replicate ecosystems are plotted as time series. The abundance estimates are plotted in Left, and the temporally aligned, normalized abundances are plotted in Right (Materials and Methods). In all panels, data from the reference replicate used for temporal alignment is plotted in a darker color. All counts are incremented by to avoid divergence of zero counts on the log scale.

