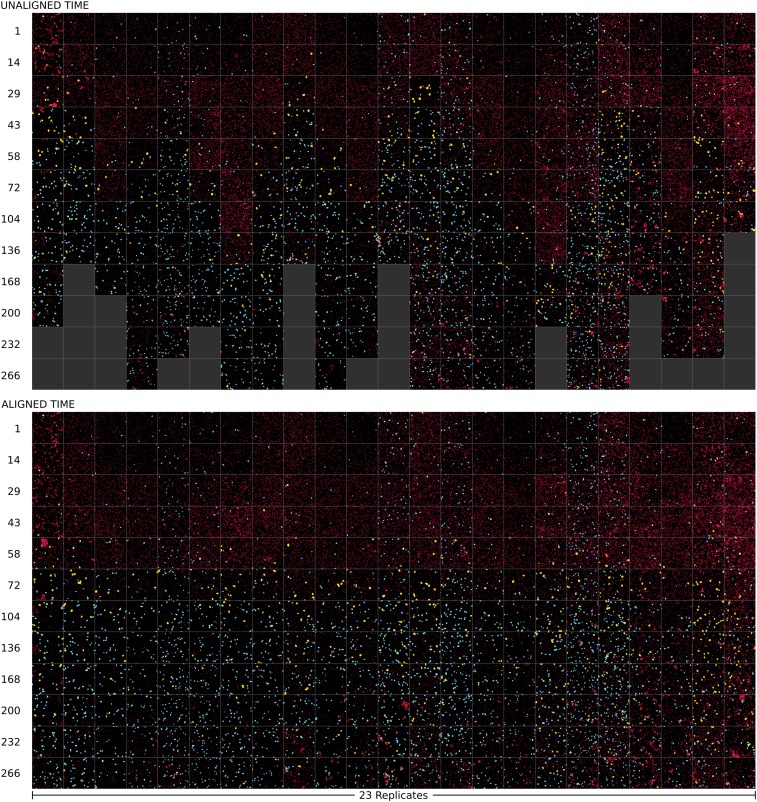
Fig. 5.
Time course of images from 23 replicates of the synthetic Tt/Cr ecosystem. In both Upper and Lower, each column represents the same replicate ecosystem. Each row corresponds to 12 different time points, where images are taken from the raw time (Upper) or from the aligned time (Lower) relative to a reference experiment. To show sufficient detail, we selected the most representative subimage of size m for that replicate and time (SI Appendix). To account for slight differences in fluorescence intensity across replicates, Cr singlets are shown by a circle of fixed size, and to allow visual identification of cell classes, all cells are pseudocolored by class (Cr in red, s-Tt in cyan, and l-Tt in yellow). Filled dark gray boxes in Upper indicate that data acquisition for that particular replicate had ended before that time. Times are indicated in hours to the left of each row (Upper, raw time; Lower, aligned time).

