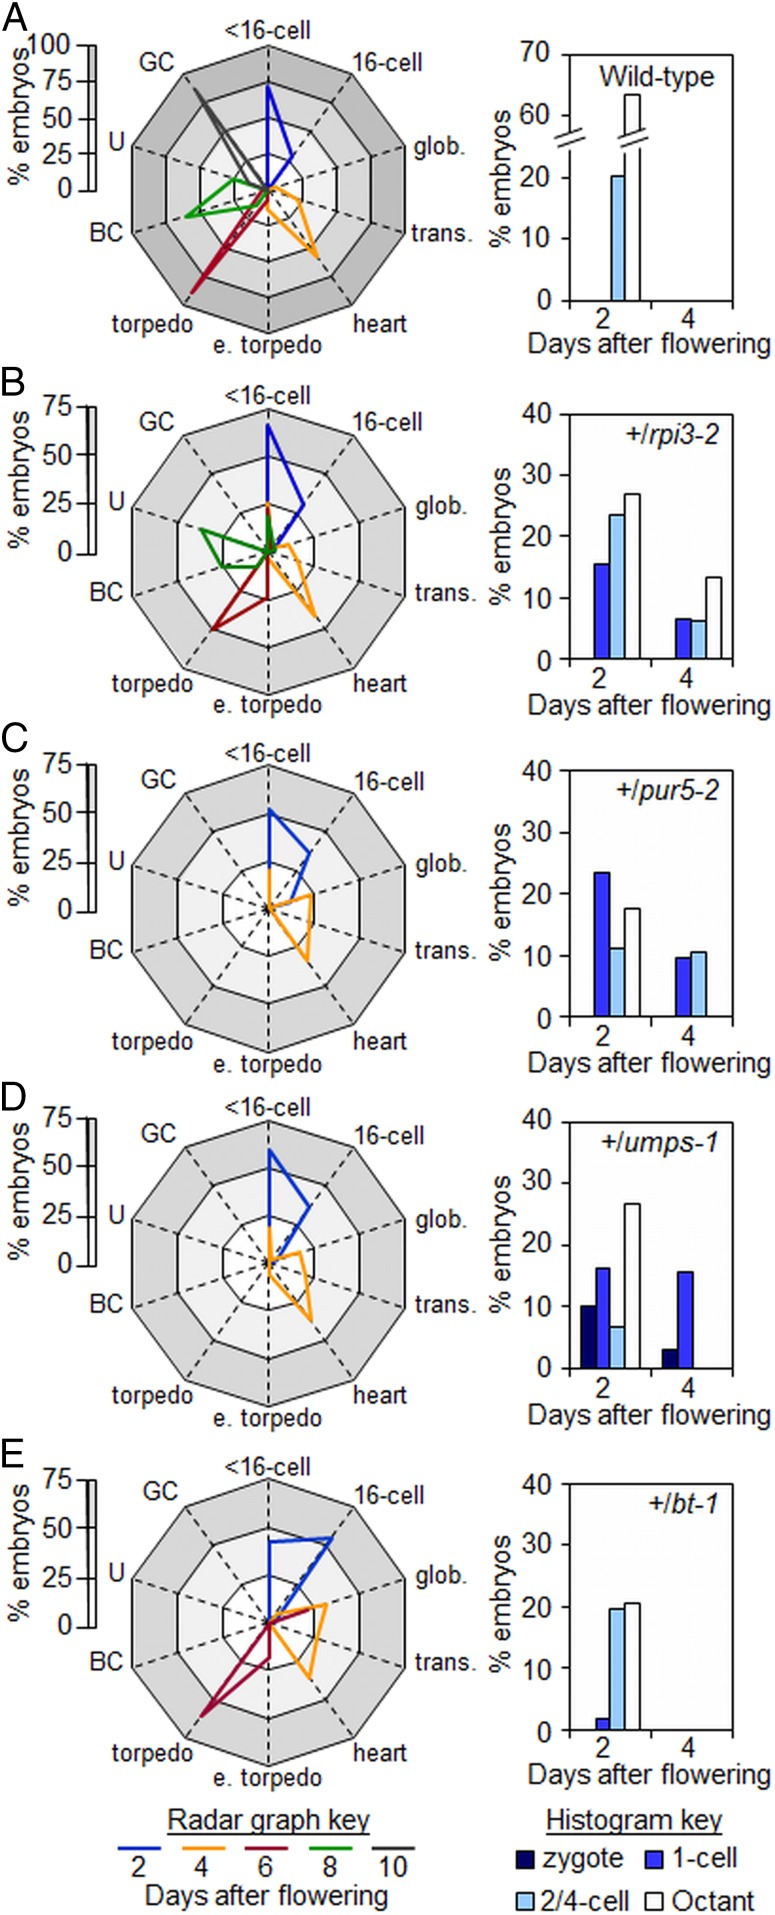
Fig. 4.
Developmental progression of embryos from wild-type and heterozygous plants. (Left) Radar graphs showing the developmental stages of embryos at particular time points (key at the base of the figure). Within each graph the white zone represents 0–25%, the light gray zone 25 to 50%, and the gray zone 50–75% of embryos examined. In A the dark gray zone represents 75 to 100% of embryos examined (for clarity the scale is 0 to 100% in A and 0 to 75% in B–E). (Right) Histograms of the distribution of embryos at preglobular stages of development (referred to as <16 cells in the radar graphs) at 2 and 4 DAF. Seeds were from (A) wild-type, (B) +/rpi3-2, (C) +/pur5-2, (D) +/umps-1, (E) +/bt-1 plants. Abbreviations: BC, bent-cotyledon; e. torpedo, early torpedo; GC, green cotyledon; glob., globular; trans., transition; U, upturned-U. See SI Appendix, Table S4 for original data.

