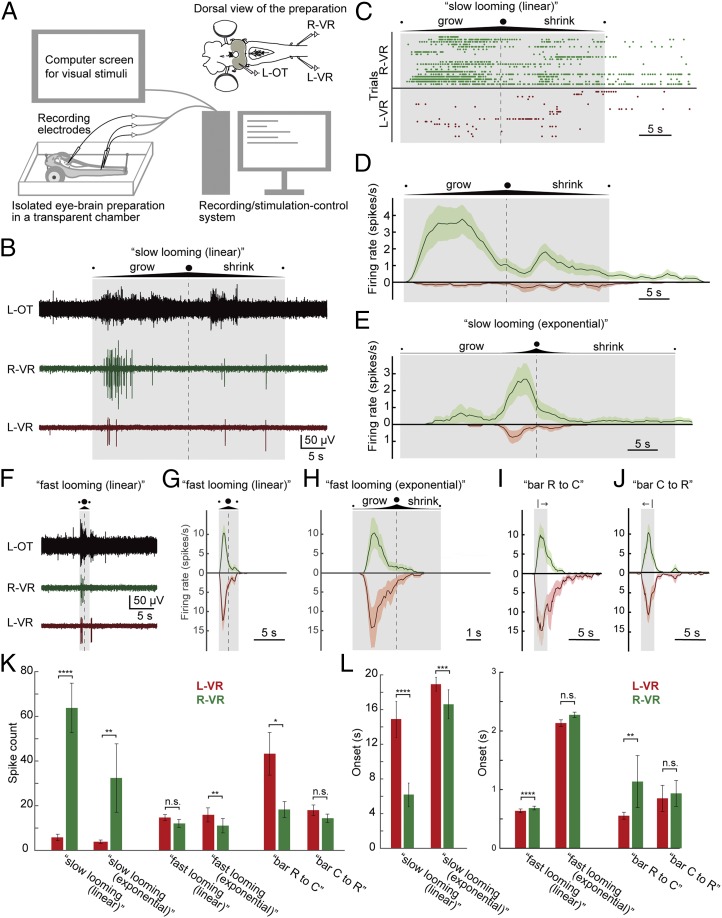
Fig. 2.
Motor response to looming/bar visual stimuli applied at different speeds. (A) Schematic illustration of the experimental system. (Top Right) Isolated eye–brain preparation was placed in a cooling chamber perfused with aCSF, and neural activity was recorded from the left optic tectum (L-OT) and ventral roots on both sides (left ventral root [L-VR] and right ventral root [R-VR]). A computer screen for presenting visual stimuli was placed on the right side of the preparation connected to a computer, which was used to synchronously control the recordings and the visual stimulation. (B) Tectal and ventral root activity evoked by the “slow looming (linear)” visual stimuli (a looming dot on white background, linearly expanding to cover the entire screen at the maximum limit and then shrinking at 3.5 cm⋅s−1). The duration of the stimulus and the point of maximum expansion are shown by a shaded box and a dashed line, respectively. Note that the ventral root on the orienting right side (green) is more strongly activated, compared with the left side (red). (C) Raster plots for “slow looming (linear)” showing the evoked spikes in the ventral roots over time for 20 trials. (D) PSTH for “slow looming (linear)” stimuli showing spike probability through time, combining data from the raster plots. Data are represented as mean ± SEM. (E) PSTHs for “slow looming (exponential)” based on 10 trials. Here “exponentially” growing (and shrinking) dots are used to simulate a situation where a circular project approaches the eye with constant speed (the diameter of the circle increases/decreases 1.35-fold per second). Similar to the “slow looming (linear),” “slow looming (exponential)” stimuli also preferentially evoke ventral root activity on the orienting right side (green). (F) Tectal and ventral root activity evoked by “fast looming (linear)” visual stimuli, 10-fold faster than “slow looming (linear)” (i.e., growing and shrinking 35 cm⋅s−1 on the screen). (G) PSTHs for “fast looming (linear)” visual stimuli based on 27 trials. Note that the ventral roots on both sides are activated. (H) PSTHs for “fast looming (exponential)” stimuli (the diameter of the circle increases/decreases 18.7-fold per second) based on 10 trials. Likewise, the ventral roots on both sides are activated. (I and J) PSTHs for visual stimuli consisting of black vertical bars moving from rostral to caudal (based on 16 trials) or from caudal to rostral (21 trials) with respect to the animal (with a total stimulus duration in both cases of 2.1 s). (I) When the bar moves rostral to caudal (“bar R to C”), it tends to activate the ventral roots on the evasive left side more than on the right orienting side. (J) On the other hand, when the bar moves caudal to rostral (“bar C to R”), it evokes ventral root activity on both sides in a more symmetrical manner. (K) Plots showing the average spike counts from L-VR and R-VR, respectively, for “slow looming (linear),” “slow looming (exponential),” “fast looming (linear),” “fast looming (exponential),” “bar R to C,” and “bar R to C” stimuli (also SI Appendix, Table S1). Data are represented as mean ± SEM. Slow looming stimuli evoke significantly more spikes in the ventral root on the (orienting) right side than on the left side. On the other hand, threatening-like stimuli (fast looming dots and bars) tend to activate the evasive left side stronger than the right side. (L) Plots showing the average onset. Data are represented as mean ± SEM (P values are provided in SI Appendix, Table S1). Note that different scales are used between slow looming stimuli and the others. Slow looming stimuli evoke spikes on the orienting right side significantly earlier than on the left side, while threatening-like stimuli tend to elicit activity on the evasive left side earlier than on the right side. *P < 0.05, **P < 0.01, ***P < 0.001, ****P < 0.0001. n.s., no statistical significance.

