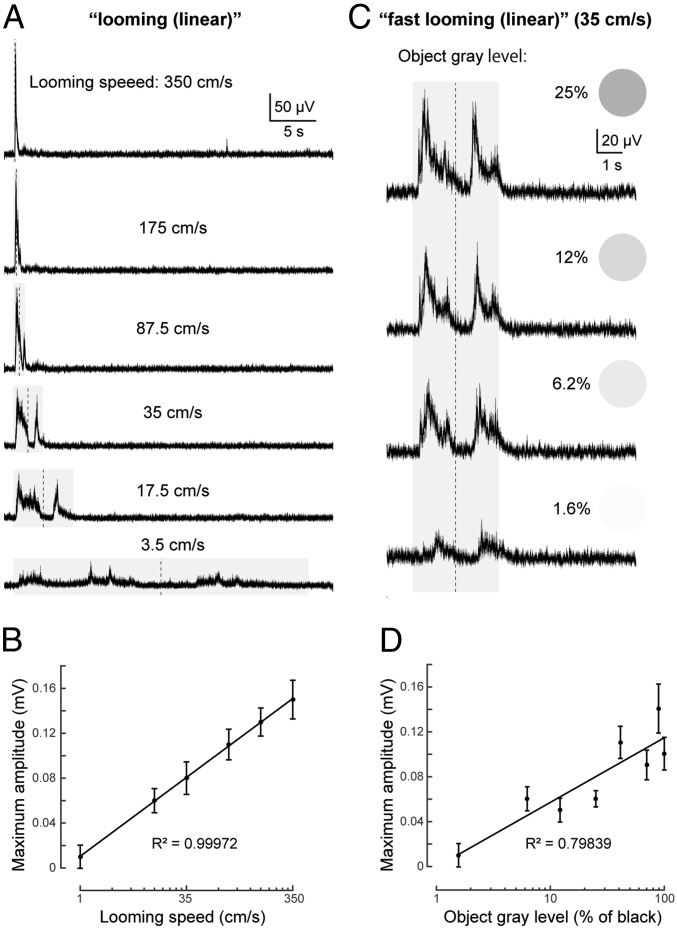
Fig. 3.
Tectal responses to looming stimuli at different speeds and contrast. (A) Averaged (10 trials each) LFPs recorded from the deep layer of tectum for “looming” (linear) stimuli at different speeds, from 3.5 to 350 cm⋅s−1. Stimulus duration is shown by the shaded area, and the vertical dotted line shows the point of maximum expansion. (B) Graph showing the strong log-linear correlation between maximum amplitude of LFPs and relative speed. Data are represented as mean ± SEM. (C) Averaged (of 10 trials each) tectal LFPs evoked by “fast looming (linear)” stimuli (35 cm⋅s−1) with different levels of gray (1.6%, 6.2%, 12%, and 25%; with 0% being white and 100% black). Averaged LFPs in response to a black looming stimulus (100% gray) with the same speed (35 cm⋅s−1) can be seen in Fig. 3A. (D) Graph showing the log-linear correlation between maximum amplitude of LFPs and the object gray level. Data are represented as mean ± SEM.

