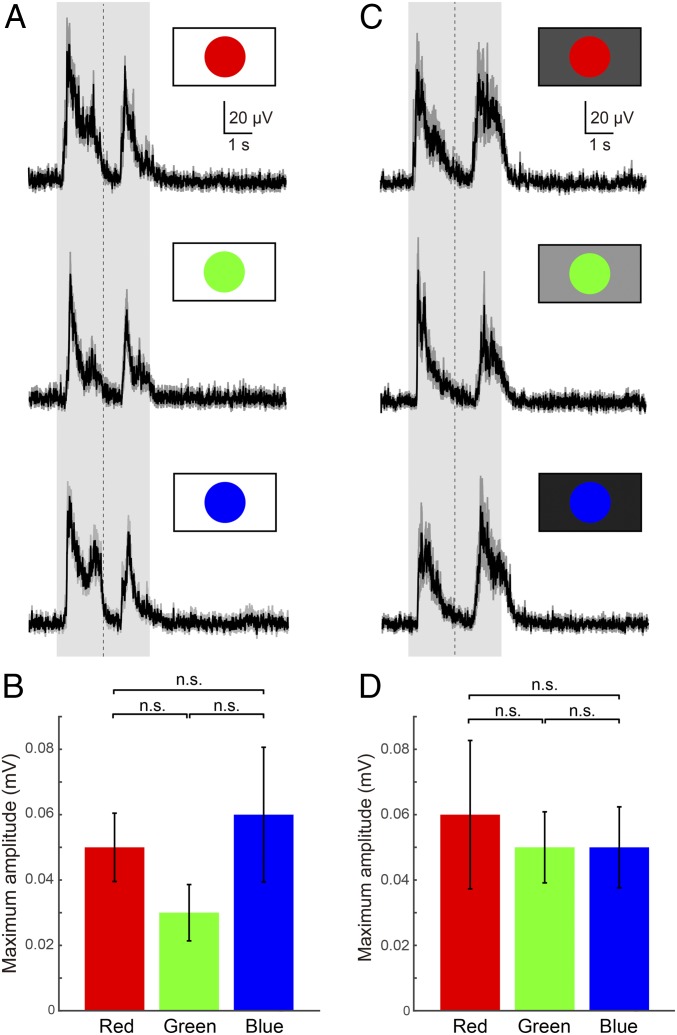
Fig. 4.
Tectal responses to looming stimuli of different colors. (A) Averaged (10 trials each) tectal LFPs in response to red, green, and blue “fast looming (linear)” visual stimuli on a white background. The shaded area indicates the duration of the stimulus, and the vertical dotted line indicates the point of maximum expansion. (B) Plots showing the average maximum amplitude of LFPs. Data are represented as mean ± SEM (P = 0.3679). (C) Averaged (10 trials each) tectal LFPs for red, green, and blue “fast looming (linear)” visual stimuli on a brightness-adjusted background (Material and Methods). (D) Plots showing the average maximum amplitude of LFPs, demonstrating that all colors can be distinguished from backgrounds with the same brightness. Data are represented as mean ± SEM (P = 0.8700). n.s., no statistical significance.

