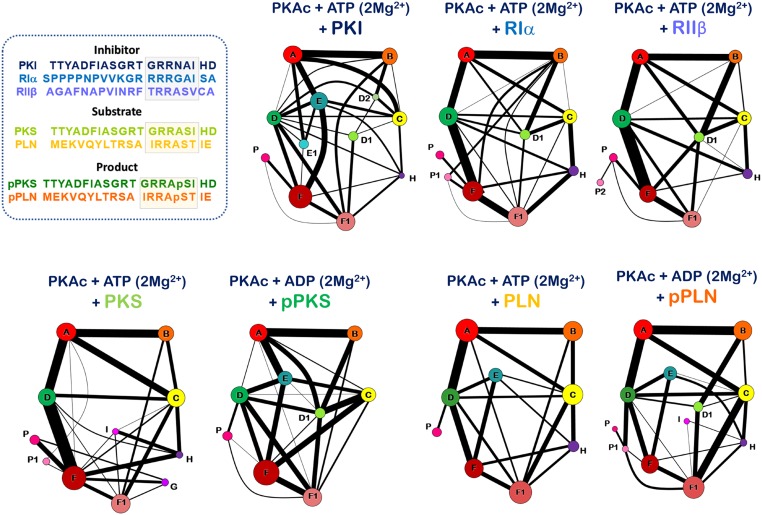
Fig. 4.
Community maps networks of the 7 kinase:peptide complexes, part II. This figure shows the community maps of the 7 complexes as a network drawing of nodes and edges. Each community is represented by a circle, whose size is reflective of the number of residues forming a part of the said community. The width of the edges joining the communities are indicative of the edge weights that connect these communities.

