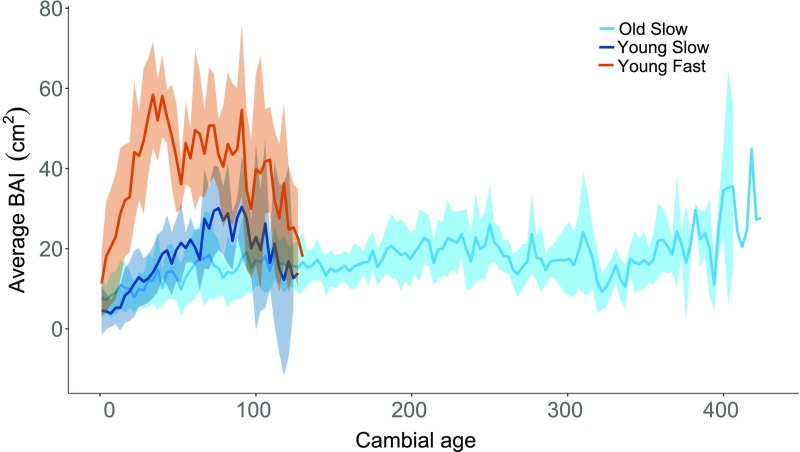
Fig. 2.
Average annual basal area increment (BAI) growth rate over cambial age (years) for each class of trees from both sites (n = 7 trees per class, 21 total). Shaded bands represent 95% confidence intervals. The oldest trees had slower average lifetime growth rates than all young trees combined (F1,19 = 5.839, P = 0.026). Slow-growing young trees had similar average lifetime growth rates compared with the old trees, but old trees did not grow as quickly as fast-growing young trees even early in life (F2,18 = 51.87, P < 0.0001).

