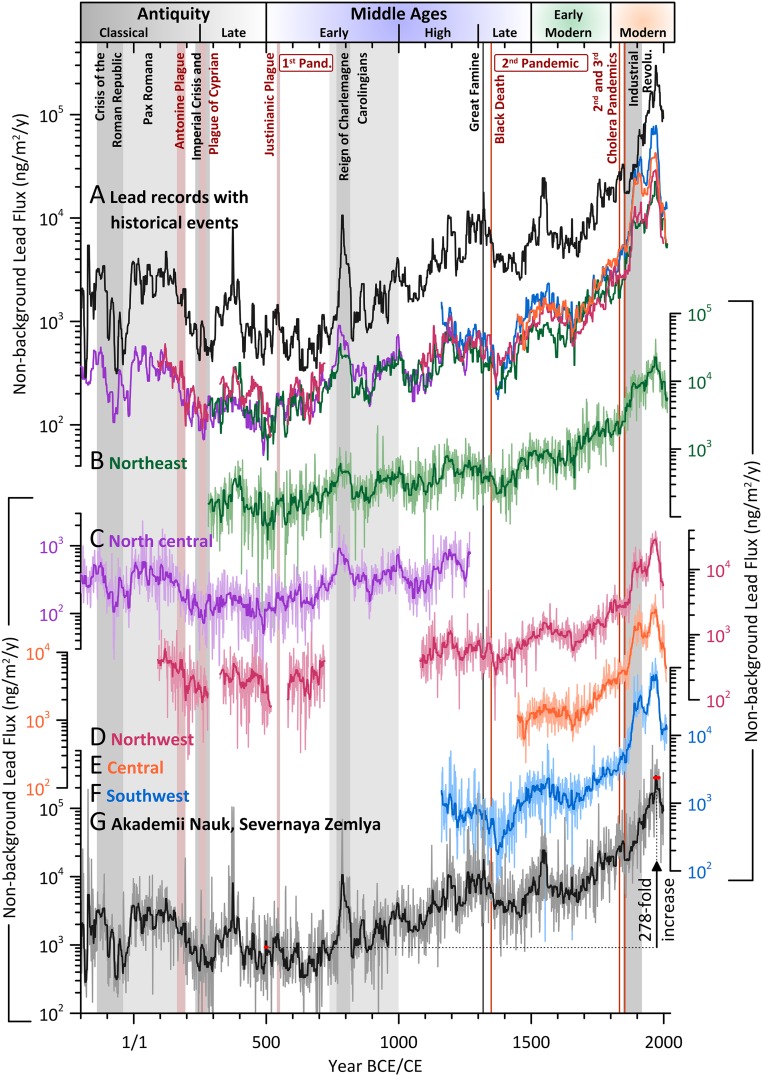
Fig. 1.
Annual lead pollution deposition during the past 2,200 y documented in an array of ice cores spanning nearly half the Arctic, including 12 ice cores from Greenland and 1 from Severnaya Zemlya in the Russian Arctic (SI Appendix, Fig. S1). (A) Median filtered (11-y) AN record from Severnaya Zemlya and Greenland regional composite records (records and colors same as in B–G) on the same logarithmic scale. (B–F) Individual Greenland regional composites (annual and 11-y median filtered values shown with thin and thick lines, respectively). (G) AN record from Severnaya Zemlya. The individual Greenland ice core records (SI Appendix, Fig. S1 and Table S1) were grouped by location and regional records of annual concentration (SI Appendix, Fig. S2), flux, and enrichment (SI Appendix, Fig. S3) were computed as the geometric mean of the individual ice core records. The ACT2 (4) and the 200 BCE to 800 CE part of the NGRIP2 (2) record have been published previously (SI Appendix, Table S1). Measurements in the few previously reported Arctic lead measurements (3–5), all confined to the central region of the Greenland ice sheet, are consistent with the records presented here (SI Appendix, Fig. S2). Because accurate dating of ice core records is critical for meaningful historical interpretation, all cores were volcanically synchronized to an accurately dated Arctic reference record (Materials and Methods). Uncertainties in the individual core chronologies were estimated to be <2 y (2) for the Greenland records and <5 y for the AN core (Materials and Methods). Widespread pollution increased more than 250-fold from the Early Middle Ages to 1970s, with sharp, often sustained increases coincident with periods of political stability (e.g., early Carolingian Empire) and exploitation of new mining regions, and decreases coincident with plagues (e.g., Black Death, second plague pandemic from 1348 to ∼1700 CE; second cholera pandemic from 1829 to 1837 CE; third cholera pandemic from 1846 to 1860 CE), climate (e.g., Little Ice Age), major wars, and other externalities. Similar variability throughout the Arctic array indicates large-scale, common changes in lead emissions.

