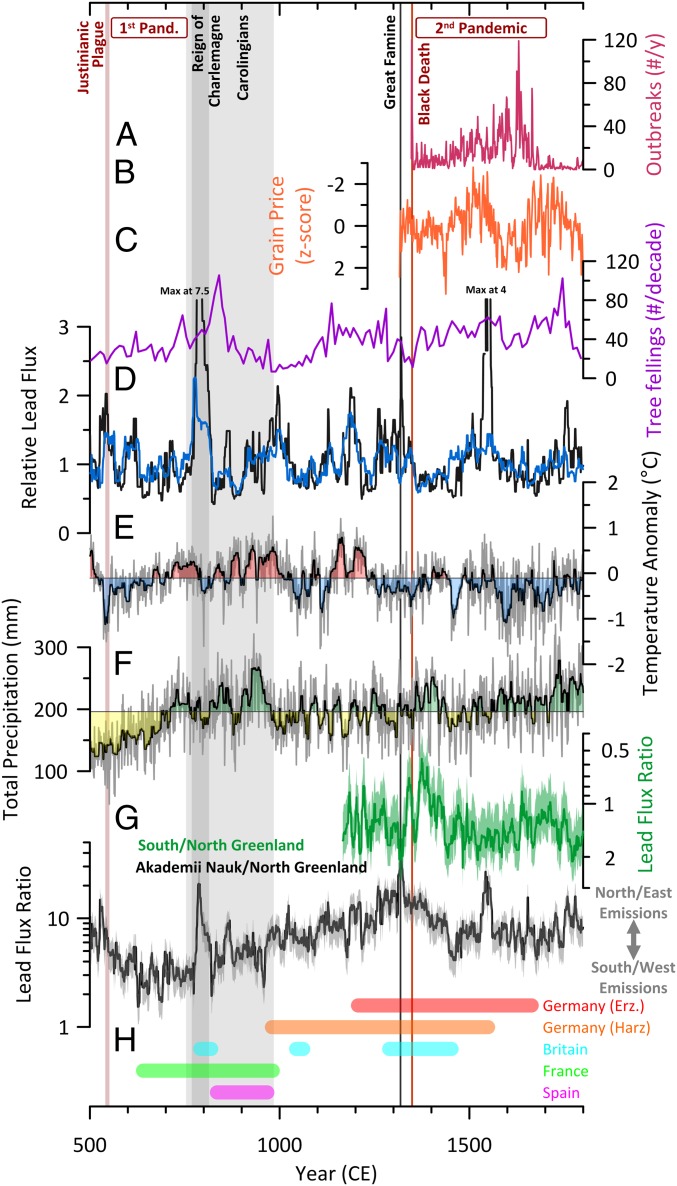
Fig. 4.
Arctic lead pollution compared with indicators of plague, economic conditions, and climate from 500 to 1800 CE: (A) number of plague outbreaks per year (29), (B) average European grain prices (11), (C) tree fellings per decade from historical construction timbers (12), (D) relative lead pollution flux in NG (blue) and AN (black) calculated by subtracting a 600-y spline fit from the log-transformed deposition records, (E and F) reconstructed north central European (E) temperature anomaly (41) and (F) precipitation (23), (G) SG/NG and AN/NG lead flux ratios, and (H) approximate locations and periods of known medieval and Early Modern mining activity.

