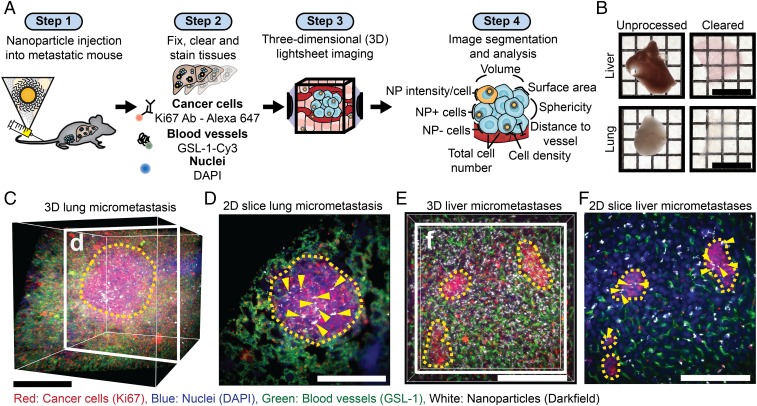
Fig. 1.
Tissue clearing, staining, and 3D imaging enable visualization of nanoparticle delivery to micrometastases. (A) Workflow for tissue preparation, imaging, and analysis of nanoparticle delivery to micrometastases. Tumors are induced and metastases form, and then nanoparticles are injected (step 1). Next, tissues of interest are optically cleared and stained with fluorescent markers (step 2). The optically cleared tissues are then imaged with light-sheet microscopy to generate 3D multichannel images (step 3). These images are then segmented to identify biological features of interest (nuclei, blood vessels, micrometastases), which are used along with the nanoparticle intensity channel to quantify nanoparticle delivery (step 4). (B) Images of 1-mm sections of the liver and lung before and after optical clearing. (Scale bar, 1 cm.) (C) A 3D image of a lung containing a micrometastasis. (Scale bar, 250 μm.) (D) A 2D section of the micrometastasis in C showing nanoparticles within the micrometastasis. Yellow arrows highlight nanoparticle locations. (Scale bar, 250 μm.) (E) A 3D image of a liver section that contains multiple micrometastases. (Scale bar, 200 μm.) (F) A 2D section of E showing 3 separate micrometastases. The yellow dashed line outlines the micrometastases, and the yellow arrows show nanoparticle locations. (Scale bar, 200 μm.)

