Fig. 5.
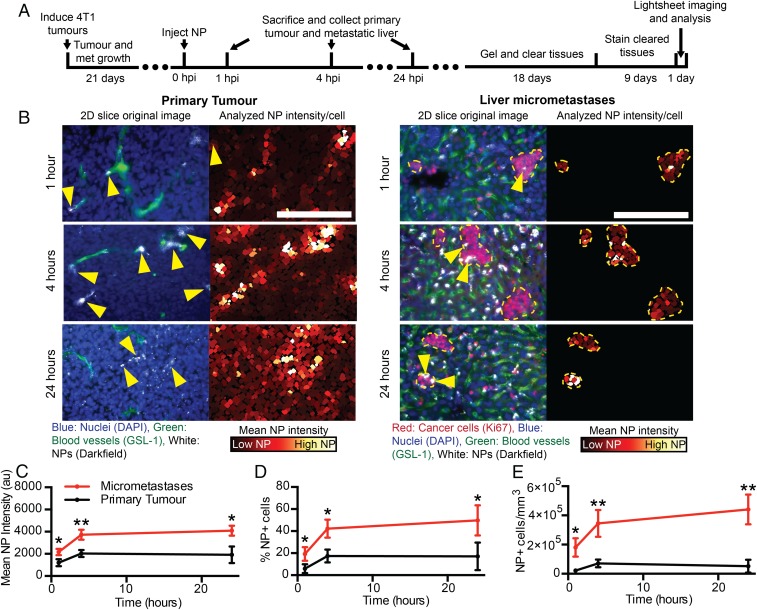
Tracking of nanoparticle delivery to micrometastases and primary tumors. (A) The time line from tumor induction to image analysis. (B) Two-dimensional cropped sections from 3D images of the primary tumor (Left column) and the liver micrometastases (Right column) at 1, 4, and 24 h post nanoparticle injection. Yellow arrows indicate nanoparticle locations. (Scale bar, 200 μm.) The mean nanoparticle intensity (C), percentage of nanoparticle cells (D), and density of nanoparticle-positive cells (E) in the primary tumor and micrometastases over time. n = 3 for each time point. *P < 0.05, **P < 0.01. Error bars show SD. NP, nanoparticle. HPI, hours post injection.

