Fig. 6.
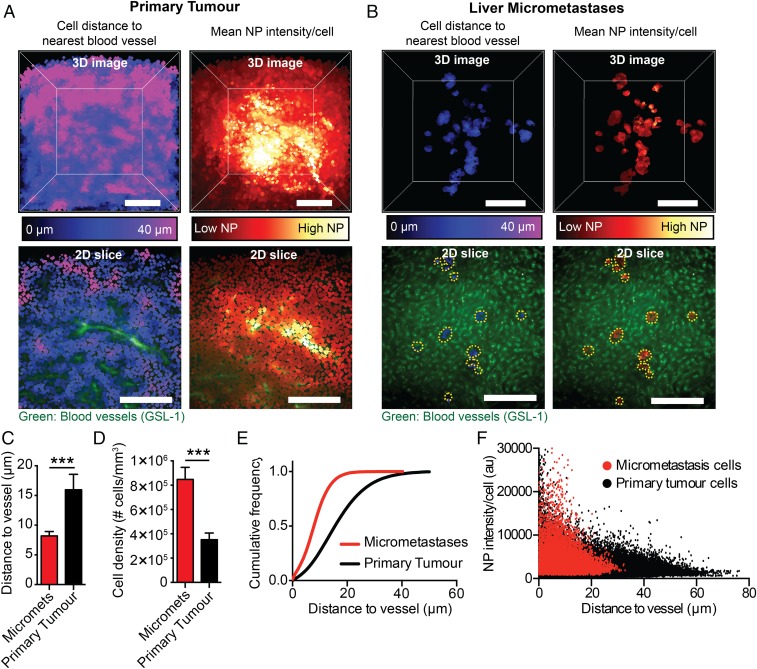
Cells in the primary tumor are farther from blood vessels than those in micrometastases. An example of a 3D analyzed image of a primary tumor (A) or liver containing micrometastases (B) showing the average cell distance from the nearest blood vessel (cells close to vessels are dark blue; cells far away are pink) and the mean nanoparticle intensity per cell (cells with low nanoparticle intensities are dark red; cells with high nanoparticle intensities are yellow-white). The Lower 2 panels are 2D slices of a section of the primary tumor or liver with micrometastases with the blood vessels and the average cell distance to the nearest blood vessel or mean nanoparticle intensities. The yellow dashed line outlines the micrometastases. (Scale bar, 200 μm.) (C) The average cell distance to the nearest blood vessel in micrometastases and the primary tumor. (D) The cell density in micrometastases and the primary tumor. (E) The cumulative frequency of cells as a function of distance to the nearest blood vessel in micrometastases and in the primary tumor. (F) The mean nanoparticle intensity of individual cells in micrometastases and the primary tumor as a function of distance to the nearest blood vessel 24 h post injection. n = 9 for C and D. n = 3 for E and F. ***P < 0.001. Error bars show SD. NP, nanoparticle.

