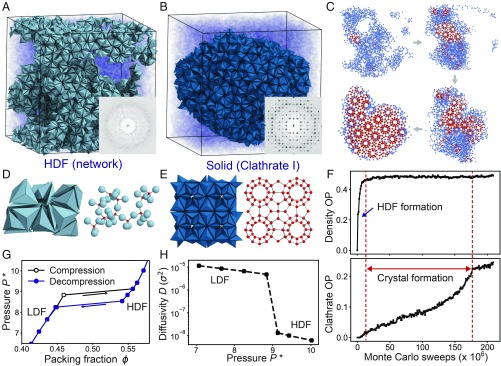
Fig. 6.
Crystallization of clathrate I (cP92) via network formation. Hard TBPs self-assemble into clathrate I at constant packing density . (A) A snapshot from the early stage of TBP crystallization, where an LDF (transparent blue) and an HDF (light blue) coexist. (B) A snapshot of the final stage of TBP crystallization, where the TBP clathrate (dark blue) coexists with the LDF (transparent blue). (Insets) Diffraction patterns. (C) Snapshots of the crystallization process using a network representation that connects TBP tetramer centers. The HDF is colored in blue and the clathrate is colored in red. (D) Local motifs found in the HDF (Left). Centers of tetramers (Right, red spheres) can be mapped onto nodes of a tetrahedral network. (E) Unit cell of the TBP clathrate crystal (Left). Centers of tetramers can be mapped onto an atomic clathrate I structure (Right, red spheres). (F) Evolution of the density order parameter (Top) and a clathrate order parameter (Bottom). Definitions for order parameters are found in Methods. (G) Equation of state of hard TBPs. Each data point is obtained by a single isobaric Monte Carlo run initialized in a disordered starting configuration for compression (black line) and initialized in an HDF configuration for decompression (blue line). (H) Diffusivity of the 2 fluids near the LDF-to-HDF transition.

