Fig. 1.
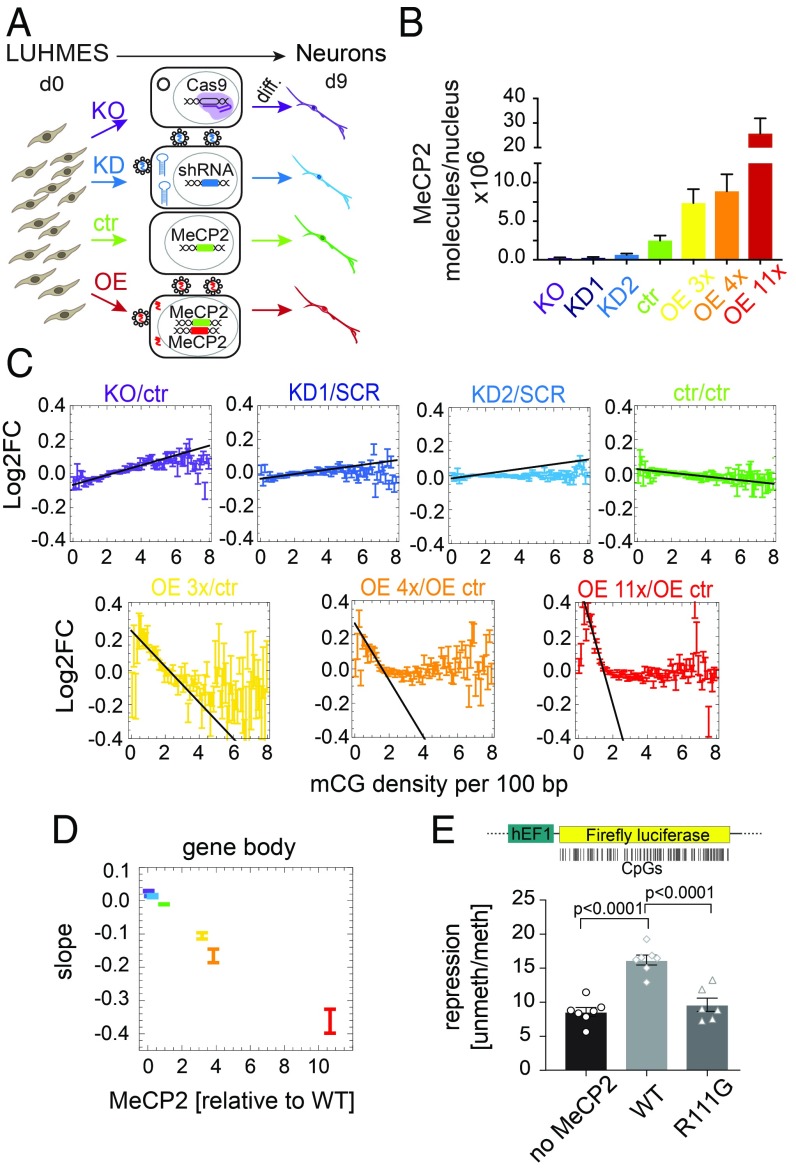
Gene expression strongly correlates with gene body mCG density and MeCP2 abundance. (A) Experimental design (Materials and Methods). d0, day 0; d9, day 9. (B) Mean number of MeCP2 molecules per nucleus. (C) Log2 fold change of gene expression (Log2FC) relative to appropriate controls (ctr, unmodified controls; SCR, scrambled shRNA control; OE ctr, overexpression control) for all seven levels of MeCP2, plotted against gene body mCG density. All Log2FC values have been shifted so that Log2FC averaged over all genes is zero. Black line indicates the maximum slope. (D) The maximum slope for gene bodies varies proportionally to MeCP2 abundance. (E) Ratio between luciferase expressions from an unmethylated and gene-body methylated constructs, for three cases: no MeCP2, WT MeCP2, and a methyl-CpG binding domain mutant R111G that is unable to bind mCG. Points show individual replicates. In all panels, error bars represent ±SEM.

