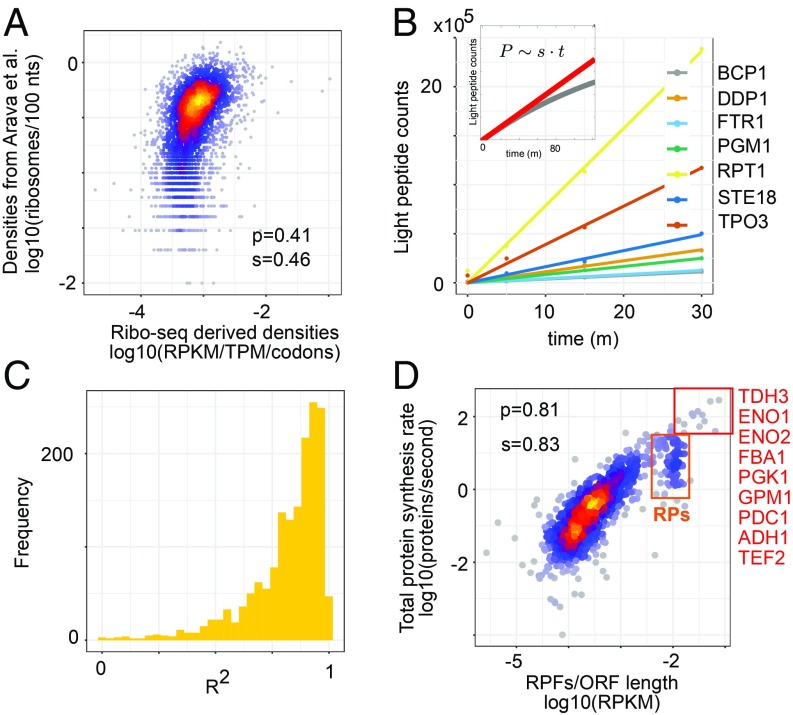
Fig. 2.
Analysis of protein synthesis rates. (A) Ribosome densities derived from the sequencing of RPFs (x axis) or estimated based on the relative abundance of RNAs across polysomal fractions in ref. 19 (y axis). (B) Protein synthesis rates s can be estimated from the dynamics of light peptide (P) accumulation within a short time interval t (in minutes) after medium change (Inset). Examples of linear fits to the peptide accumulation curves for the proteins indicated in the legend. (C) Histogram of R2 values of the linear fit for all 1,616 measured proteins. (D) Relationship between ribosome allocation per codon and the protein synthesis rate. Highlighted in the red box are the proteins with highest synthesis rates. The orange box highlights the cluster of RPs. p and s are Pearson’s and Spearman’s correlation coefficients, respectively.

