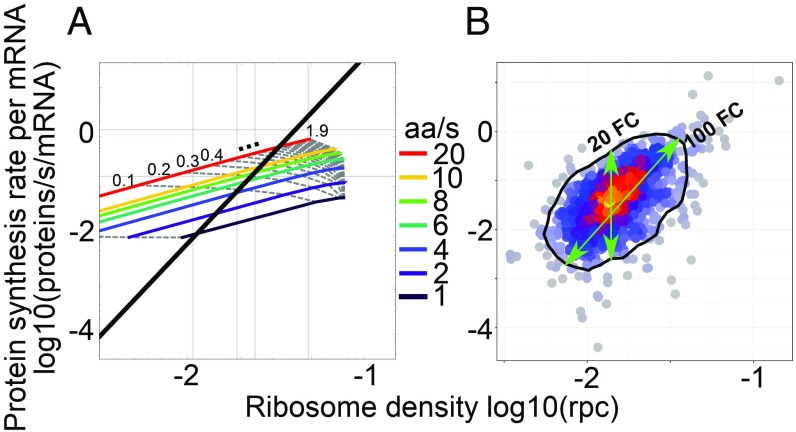
Fig. 3.
Predicted and observed relationship between the protein synthesis rate and the ribosome density on the corresponding ORF. (A) TASEP model predictions with isoclines corresponding to individual translation initiation (gray dotted lines; rate range, 0.01 to 1.9/s; increments of 0.1 starting from second line at 0.1; mean, 0.04/s) and elongation rates (colored lines; rate range, 1 to 20 aa/s). Superimposed is the first principal component of the experimental data shown in B, for which the mean initiation and elongation rates were 0.04/s and 2.63 aa/s, respectively. (B) Similar visualization of experimental results: protein synthesis rates were measured by pSILAC and converted to molecules per mRNA per second from the expected protein mass doubling time; ribosomes densities were obtained from the fit of ribosome footprint densities to numbers of ribosomes per codons (rpc) estimated by ref. 19. The black contour indicates 90% of the empirical distribution approximated through the 2D kernel density estimation from the R package “MASS.”

