Fig. 4.
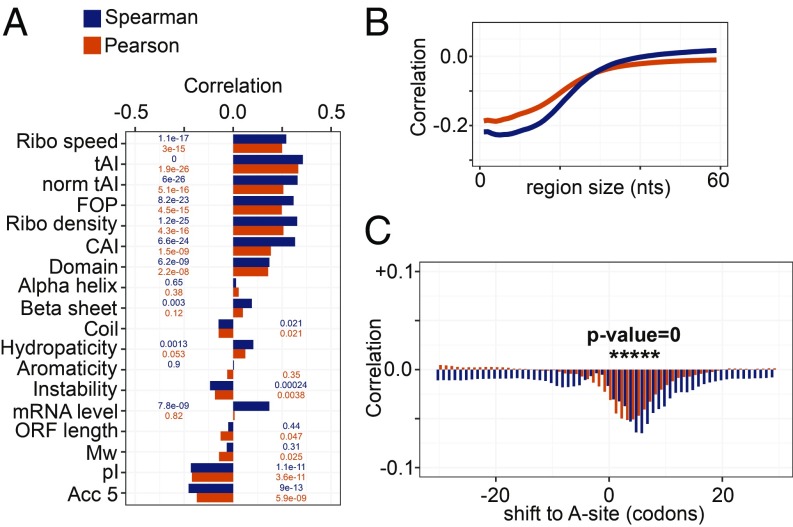
Determinants of translation elongation rate in yeast. (A) Correlation coefficients (P values indicated on the bars) of SDR with features related to codon speed, biochemical properties of the encoded protein, and RNA secondary structure accessibility. (B) Correlation coefficients of the average accessibility of regions in the ORF of length indicated by the x axis with SDR. (C) Correlation coefficients of SDR with the probability of regions of 20 nt starting at the position indicated on the x axis relative to the A site to be in single-stranded conformation. Positions where the correlation coefficients are highly significant (P value of 0) are marked by asterisk. In all panels, Spearman and Pearson correlation coefficients are shown in blue and orange, respectively.

