Fig. 5.
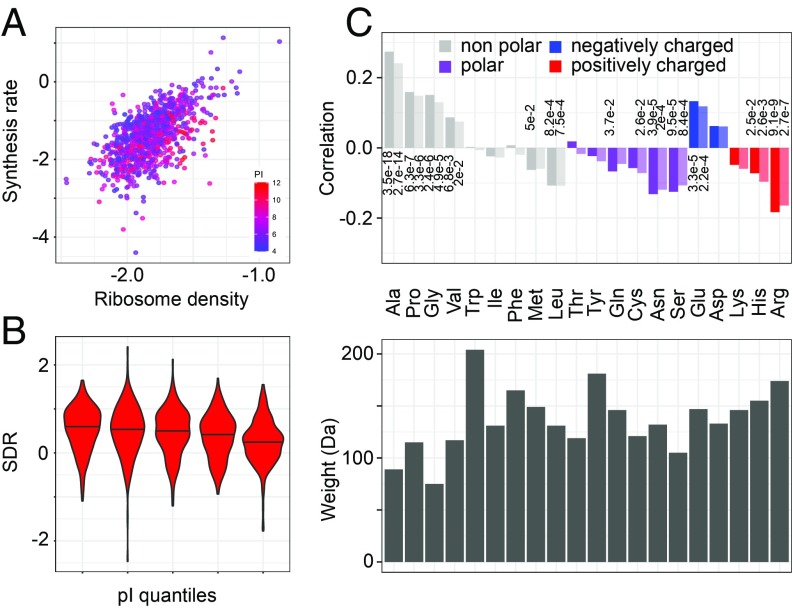
Influence of encoded amino acids on the translation elongation rate. (A) Positively charged proteins have low synthesis rate for the density of ribosomes on their corresponding ORFs. Each point represents an mRNA, with x and y coordinates corresponding to the ribosome density and protein synthesis rate, respectively, both on a log10 scale. The color indicates the isoelectric point of the encoded protein, red indicating proteins with high pI (positively charged) and blue indicating proteins with low pI (negatively charged). (B) SDR distributions for increasing isoelectric point quantiles (left–right bins, t test, P = 2e-8). (C) Spearman (dark shade) and Pearson (light shade) correlation coefficients of SDR with amino acid frequencies in the encoded proteins (Top; only values of P < 0.05 are shown) and respective amino acids sizes (Bottom).

