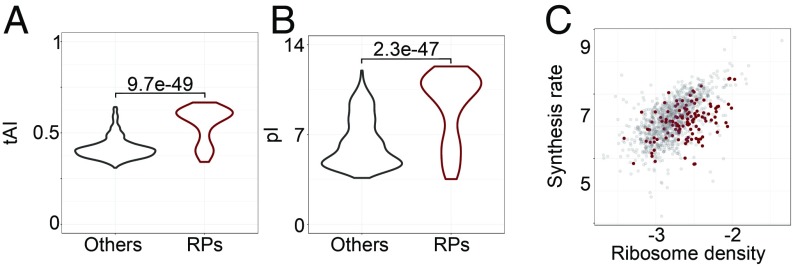
Fig. 6.
Properties of RPs (n = 122) compared with all other quantified yeast proteins (n = 992). Box plots of (A) tRNA adaptation index of individual ORFs and (B) isoelectric point for corresponding ribosomal and all other yeast proteins. (C) Protein synthesis rate [log10(peptides/s/mRNA)] as a function of ribosome density [log10(RPKM/TPM)] for transcripts encoding RPs (brown) and all other proteins (gray).

