Fig. 7.
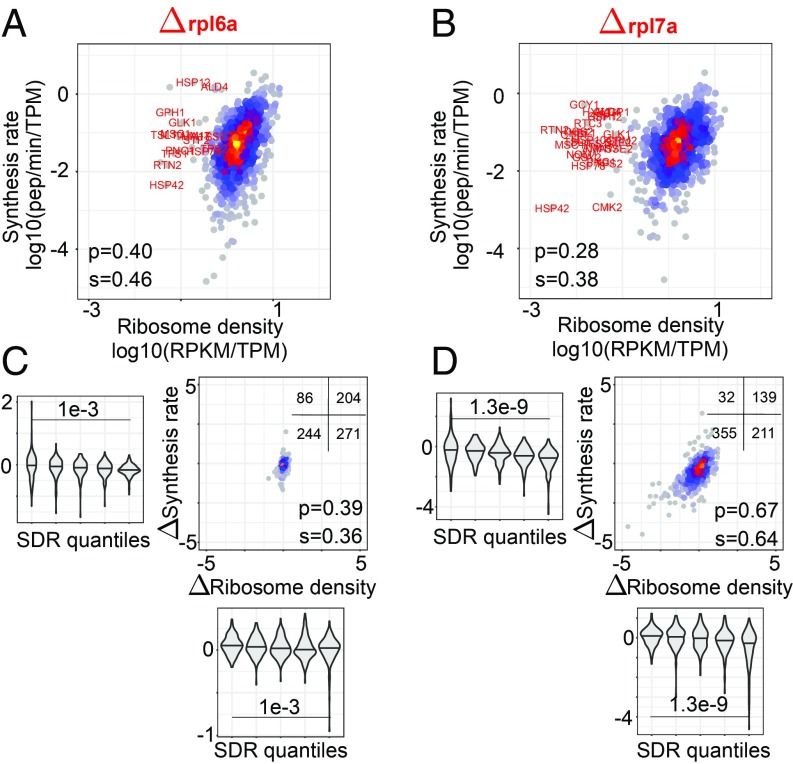
Translation parameters in yeast strains with deletions in RP genes, Δrpl6a and Δrpl7a. (A and B) Ribosome density–protein synthesis rate plots for the 2 strains; highlighted in red are outliers (having ribosome density of <0.1 RPKM/TPM; Dataset S7) in the Δrpl7a strain. (C and D) Change in the ribosome density vs. change in the synthesis rate in the Δrpl6a and Δrpl7a strains compared with wild type. The Insets show the number of transcripts in each of the 4 quadrants of the plots. In the violin plots, the distributions of density and synthesis rate changes are shown for 5 bins of SDR values (20% of transcripts in each bin), from the lowest SDR (left-most bin) to the highest (right-most bin). P values of the t test comparing the mean density and synthesis rate changes between 20% transcripts with highest and lowest SDR values, respectively, are shown.

