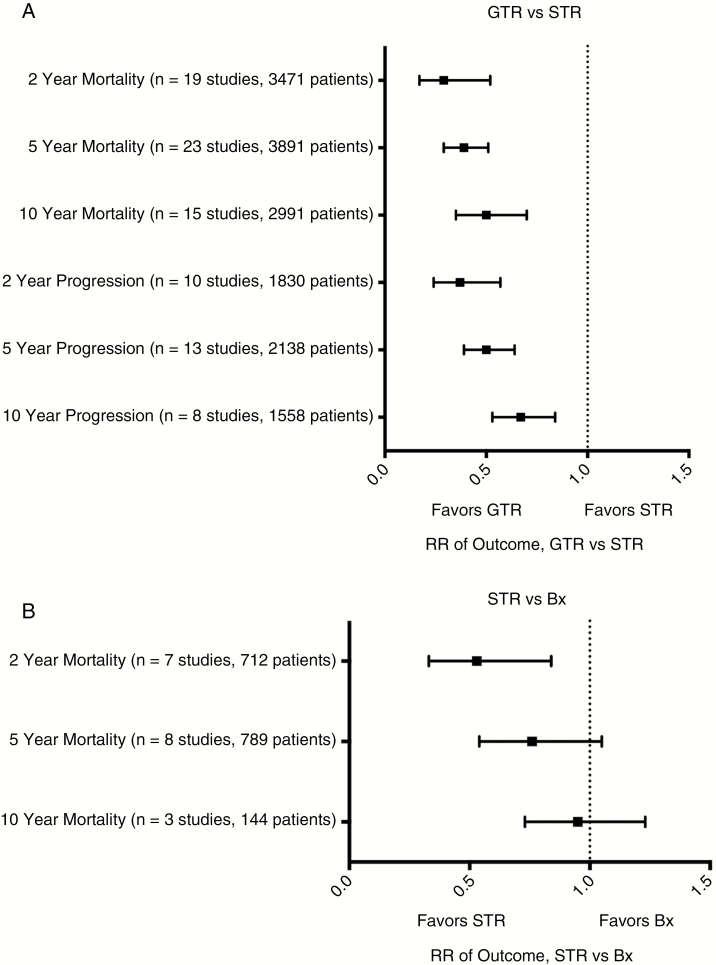
Fig. 2.
Meta-Analyses of the Extent of Resection and Outcomes in Low-Grade Gliomas.
A, Forest plot of summary statistics on the 6 comparisons regarding outcomes of patients who received gross total resection (GTR) compared to those who received subtotal resection (STR). Values plotted are relative risks (RR) with 95% confidence intervals. Summary statistics that do not cross X = 1 indicate a benefit favoring GTR over STR. B, Forest plot of summary statistics of STR vs biopsy (Bx).

