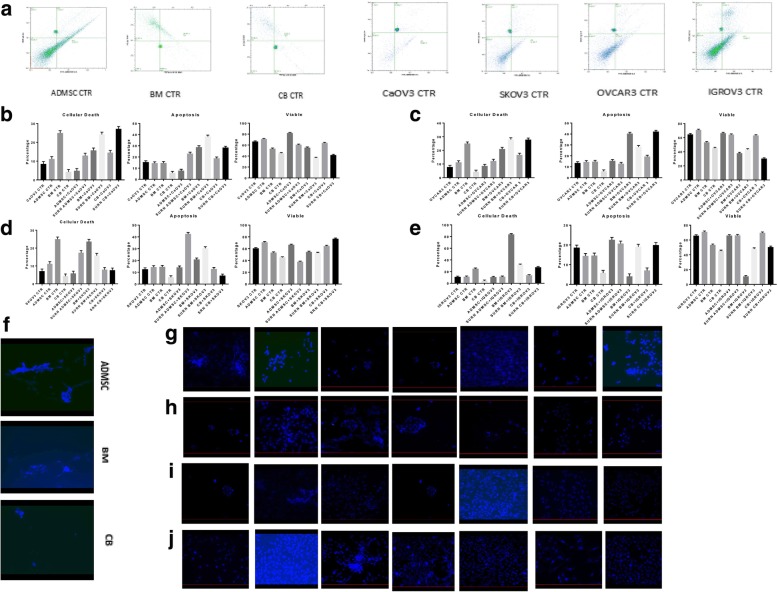
Fig. 4.
Apoptosis and cell death. a-e FCM using Annexin V /PI showed an increase in cell death in cancer cell lines. The increase rate was calculated by subtracting value from the control. Error bars represent the means ± SD, n = 5; * p = 0.051, **p = 0.005, ***p < 0.001,****p < 0.0001. f-j DAPI staining revealed an increase in blue fluorescence relative to the co-culture with MSC and/or supernatant. f MSCs control. First row (g): CAOV3 CTR, CAOV3 with ADMSC, CAOV3 with BM-MSC, CAOV3 with UC-MSC, CAOV3 with CM-ADMSC, CAOV3 with CM-BMMSC and CAOV3 with CM-UCMSC. Second row(h): OVCAR3 CTR, OVCAR3 with ADMSC, OVCAR3 with BM-MSC, OVCAR3 with UC-MSC, OVCAR3 with CM-ADMSC, OVCAR3 with CM-BMMSC and OVCAR3 with CM-UCMSC. Third Row (i) IGROV3 CTR, IGROV3 with ADMSC, IGROV3 with BM-MSC, IGROV3 with UC-MSC, IGROV3 with CM-ADMSC, IGROV3 with CM-BMMSC and IGROV3 with CM-UCMSC. Fourth Row (j) SKOV3 CTR, SKOV3 with ADMSC, SKOV3 with BM-MSC, SKOV3 with UC-MSC, SKOV3 with CM-ADMSC, SKOV3 with CM-BMMSC and SKOV3 with CM-UCMSC

