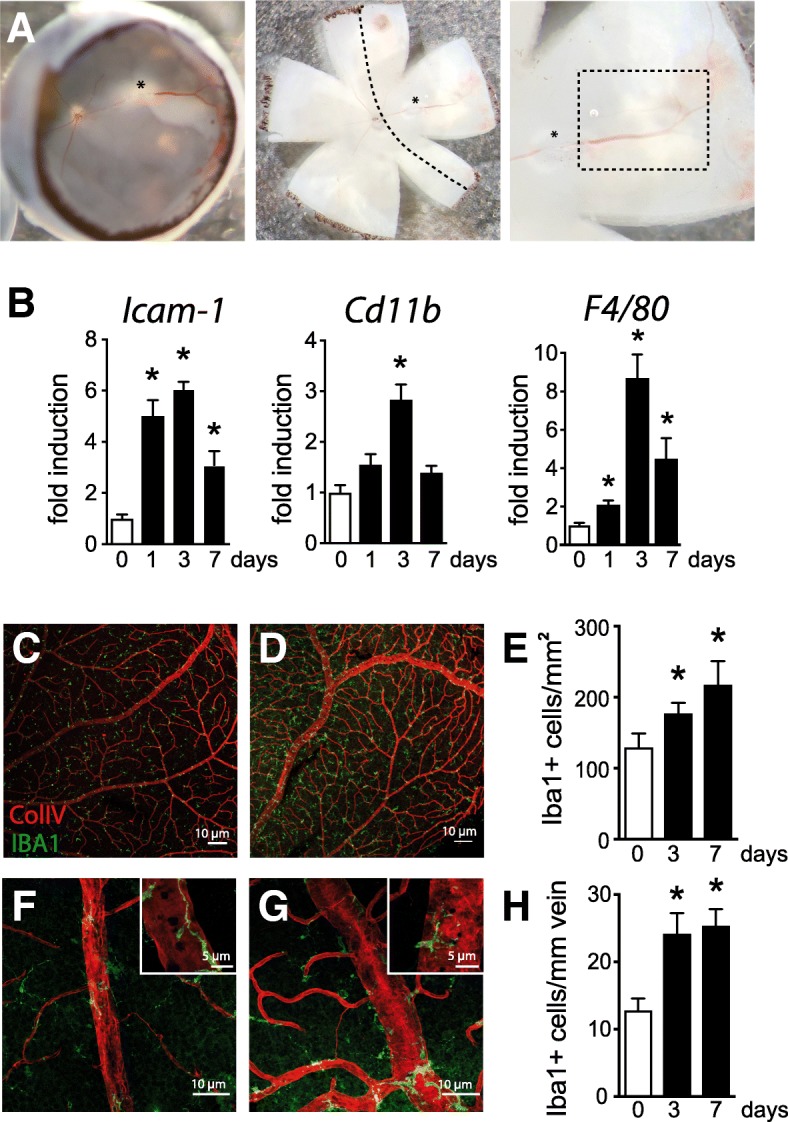
Fig. 1.

BRVO increases the number of perivascular and parenchymal mononuclear phagocytes. Photographs of the eyecup and retinal flatmount of the retina with the visible vein occlusion site (*), dilated vein, and hemorrhages at day 1 after BRVO. Dotted line shows the dissected area of the retina used for RT-PCR and the dotted rectangle the area where perivascular Mφs were counted during the study (a). Icam-1, cd11b, and F4/80 real-time RT-PCRs in the occluded retina at indicated time points. The results were normalized to S26 expression. Values in histograms are mean ± SEM of mRNA expression of occluded area from 4 eyes per group (b, n = 6, Mann-Whitney t test; Icam-1: *P = 0.0095 day 0 versus day 1, *P = 0.0047 day 0 versus day 3, and *P = 0.0095 day 0 versus day 7; Cd11b: *P = 0.0095 day 0 versus day 3; F4/80: *P = 0.0424 day 0 versus day 1, *P = 0.0047 day 0 versus day 3, and *P = 0.0095 day 0 versus day 7). Representative images of the inner retina of Iba1 (green) and ColIV (red) double-labeled retinal flatmounts of control (c) and occluded vein area 3 days after occlusion (d). Magnification on control vein in the upstream retina (f) and on the occluded vein (g) 3 days after occlusion. Quantification of the parenchymal Iba1+ Mφs per square millimeter (e, Mann-Whitney t test, Iba1+ cells/mm of vein: day 0 versus d3day *P = 0.0229 and day 0 versus day 7 *P = 0.0424) and the number of perivascular Iba1+ Mφs per millimeter of vein (h, Mann-Whitney t test, Iba1+ cells/mm2: day 0 versus day 3 *P = 0.0229 and day 0 versus day 7 *P = 0.0424) of control retinas and in the occluded vein 3 and 7 days after the occlusion. Icam-1, intracellular adhesion molecule 1; Iba1, ionized calcium-binding adapter molecule 1. Scale bar c and d = 10 μm. Inset = 5 μm. Scale bar e and f = 50 μm
