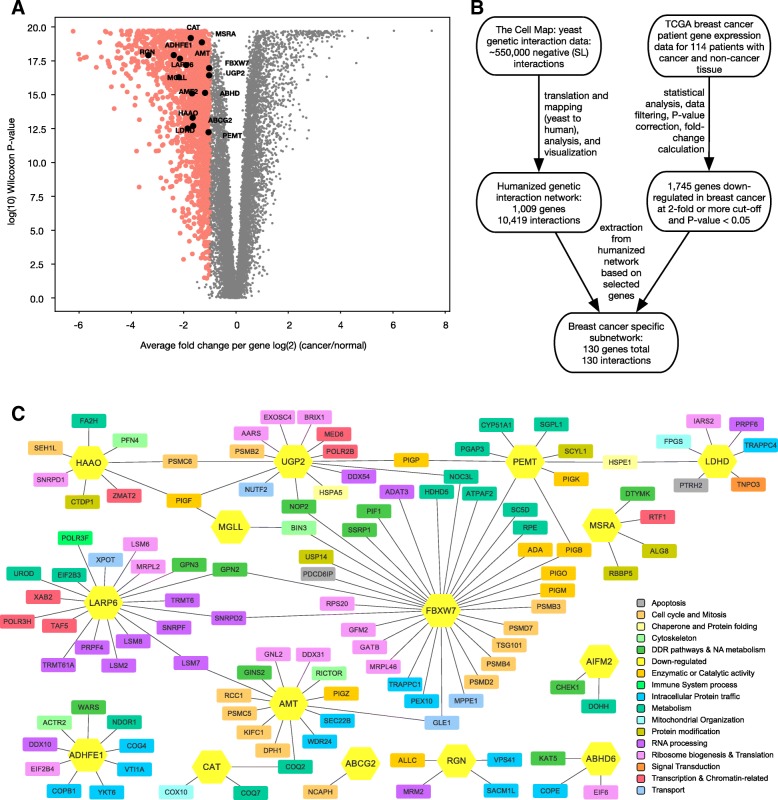
Fig. 2.
Breast cancer sub-network of SL interactions. a Volcano plot of the average change of expression per gene expressed as log2 (cancer/normal) plotted against the log10 of the adjusted Wilcoxon P-value. Dots in red represent genes that have an average 2-fold or more decrease in expression. Back dots represent the 15 genes that are also in the HYGIN network. b Flow diagram showing the flow of data and methods used to generate the breast cancer specific subnetwork. The final breast cancer network had 15 genes that are down-regulated in breast cancer and 115 genes that interact with them. As a result, there are 130 genes (nodes) total in the breast cancer subnetwork. c Visualization of the breast cancer specific subnetwork generated using 15 genes in HYGIN that were found to be down-regulated in breast cancer (yellow) and their corresponding SL gene pairs. Edges represent proposed SL interactions between genes, and nodes (coloured based on GO slim terms) represent SL partners of the 15 genes

