Figure 3.
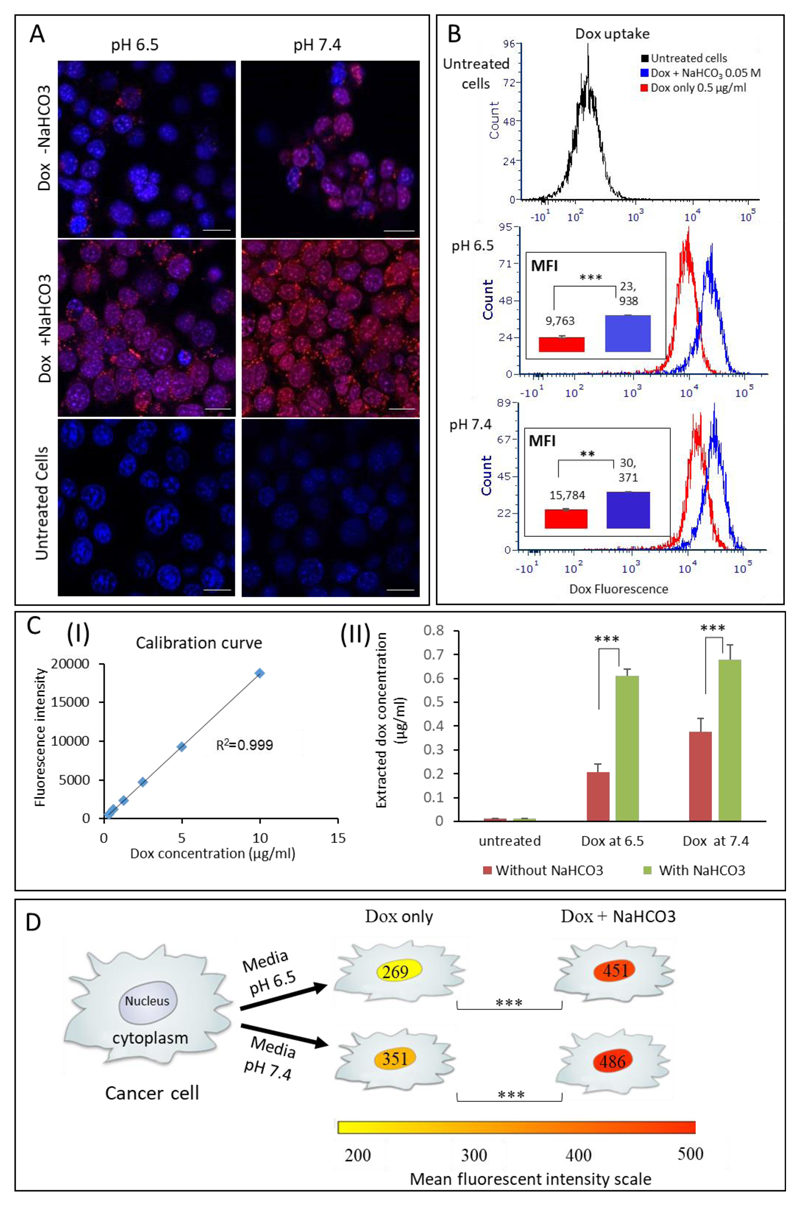
Bicarbonate enhances the uptake of doxorubicin by 4T1 breast cancer cells. (A) Increased cellular uptake of doxorubicin (red) can be seen using fluorescent microscopy after adding bicarbonate to the culture, compared to doxorubicin uptake without bicarbonate. Cell nucleus is stained blue. (B) Quantifying doxorubicin uptake using flow cytometry indicated a right-shift in the histogram of cells treated with combined treatment (blue histogram) representing a 2-fold increase in doxorubicin uptake when combined with bicarbonate. MFI represents the mean fluorescence intensity. (C) Doxorubicin concentrations after being extracted from the cells (II) with or without bicarbonate; concentrations were determined based on calibration curve of the drug dissolved in methanol (I). (D) Quantification of doxorubicin fluorescent intensity in the cell’ nuclei, measured using image analysis of more than 10,000 cells in each group. Scale bars in (A) represent 20μm; error bars represent standard deviation from 3 to 5 independent repeats. *Significant difference between treatments, where *p<0.05, **p<0.01, ***p<0.001 according to a Student’s t-test with a two-tailed distribution with equal variance.

