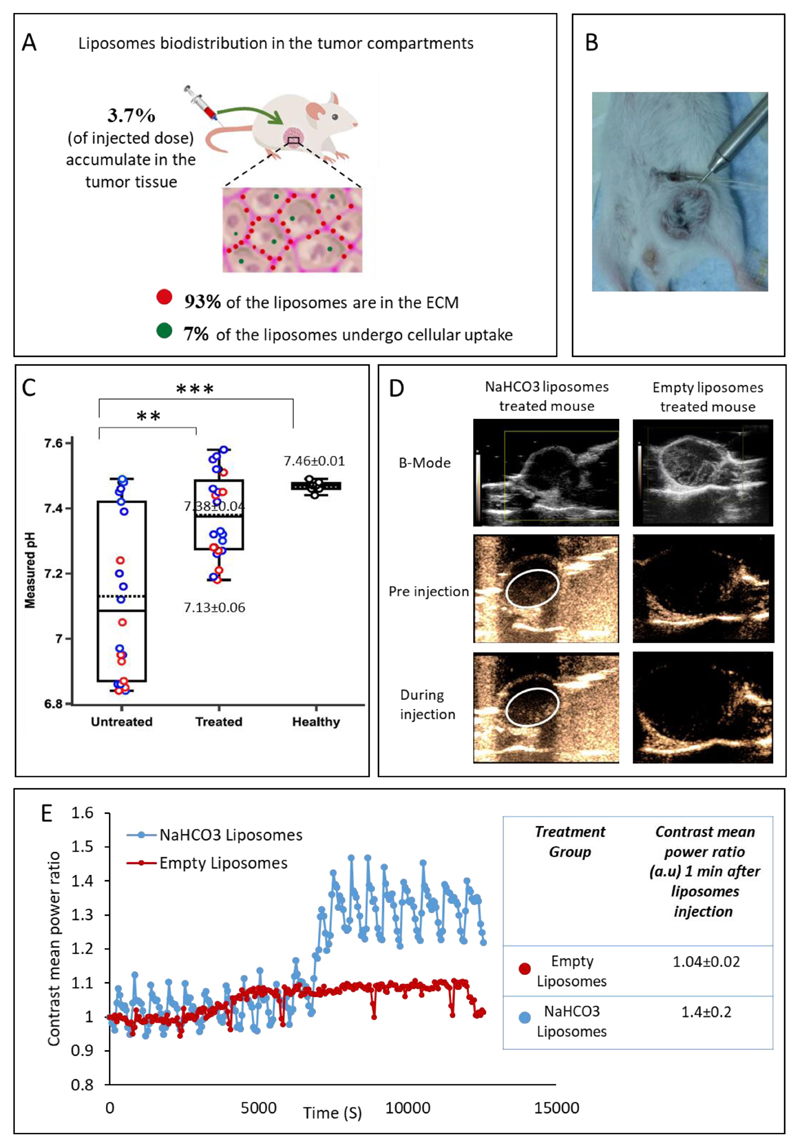
Figure 5.
Bicarbonate liposomes effect in the tumor microenvironment. (A) Bicarbonate liposomes biodistribution in the cells and extracellular matrix (ECM) of orthotopic triple-negative tumors 24 hours after intravenous injection. (B+C) In vivo pH measurements of the tumor and healthy tissue. The intra-tumoral pH was measured using microelectrodes 24-hr after administering bicarbonate liposomes (B). Treated tumors with liposomal bicarbonate modified the pH in the tumor tissue after IV injection, compared to untreated mice(C). Red circles represent pH tumor core measurements while the blue represent peripheral ones. 7.13±0.06 and 7.38±0.04 represent the averaged pH of all measurements in the untreated and treated groups respectively. pH of healthy mammary fat pad was found to be in the physiologic range, 7.46±0.01. Error bars represent standard deviation of the mean from 5-7 independent repeats. *Significant difference between treatments, where *p<0.05, **p<0.01, ***p<0.001according to a Student’s t-test with a two-tailed distribution with equal variance. (D) Breast cancer tumors ultrasound scanning before and during the injection of bicarbonate or empty liposomes. B-mode images present the tumor. Before and during the injection, images were taken using contrast-mode. (E) Contrast mean power ratio measures the change in the contrast during liposomes injection, blue curve represents bicarbonate liposomes and the red curve represents empty liposomes. The contrast means power ratios 1 min after the liposomes injection (compared to pre injection) were 1.41±0.2(n=3) and 1.04±0.02(n=3) for NaHCO3 liposomes and empty liposomes respectively (p value=0.08).

