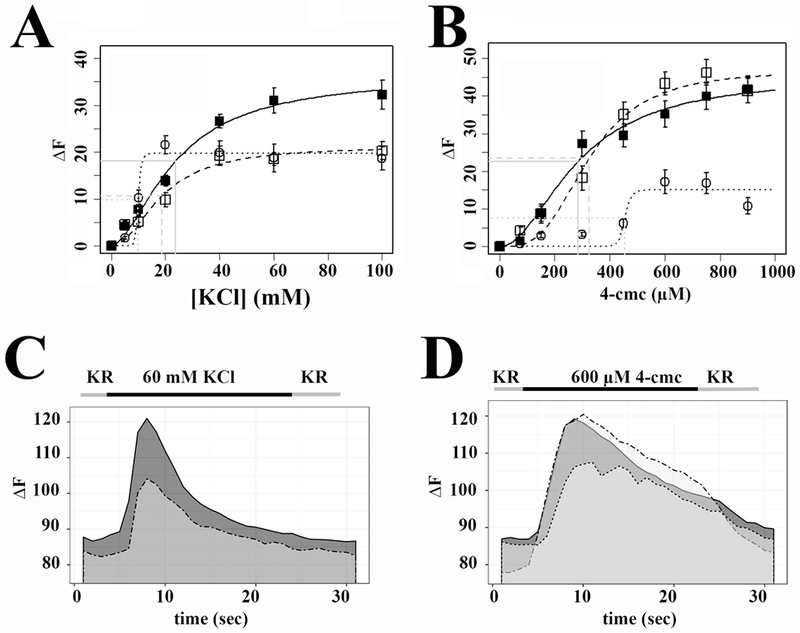
Figure 1: Calcium homeostasis and ECC are affected by the presence of SELENON mutations.

A. Depolarization (KCl) dose response curve; controls, black squares continuous line; patient N° 17, open squares dashed line; patient N°18, open circles, dotted line. B 4-chloro-m-cresol dose response curve; controls, black squares continuous line; patient N° 17, open squares dashed line; patient N°18, open circles dotted line C. Representative traces showing changes in [Ca2+]i induced by stimulation with 60 mM KCl. Continuous line, control; dashed line, patient N°17. D. Representative trace showing changes in [Ca2+]i induced by stimulation with 600 µM 4-chloro-m-cresol. Continuous line, control; dashed line patient N° 17; dotted line patient N° 18. In panels A and B, each symbol represents the mean (±SEM) peak calcium released by 5-10 myotubes.
