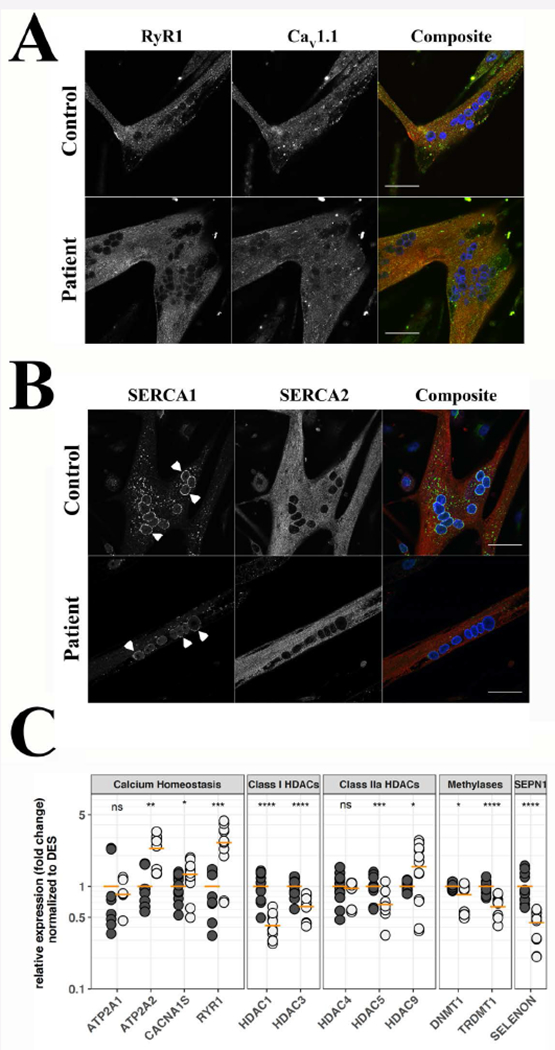
Figure 2: Cellular distribution of RyR1, Cav1.1, SERCA1 and SERCA2 and expression of selected transcripts, in differentiated myotubes from SELENON patients and healthy control.

A. Subcellular distribution of RyR1 and Cav1.1. B. Subcellular distribution of SERCA1 and SERCA2. Myotubes were visualized with a Nikon A1 plus confocal microscope equipped with a Plan Apo 60× oil objective (NA 1.4). Top panels show myotubes from a healthy control, bottom panels show myotubes from patient N° 17. The images corresponding to RyR1 are pseudocoloured in red and those corresponding to Cav1.1 in green in the composite images (right); the images corresponding to SERCA1 are pseudocoloured in green and those corresponding to SERCA2 in red in the composite images (right); DAPI (nucleus) staining is blue; orange pixels show areas of co-localization. Arrowheads in B indicate perinuclear staining of SERCA1. Bar indicates 50 µm. C. Expression levels of the indicated transcripts, as assessed by qPCR. Black circles control cells, grey circles patient cells. qPCRs were repeated 4 times on separate myotube cultures from the two patients. Horizontal orange line indicates the mean expression level in pooled data from patient N° 17 and 18. Pooled levels from control myotubes were set as 1. *P<0.05; ** <0.01; *** P<0.001; **** P<0.0001; n.s. not significantly different. Student’s t test.
