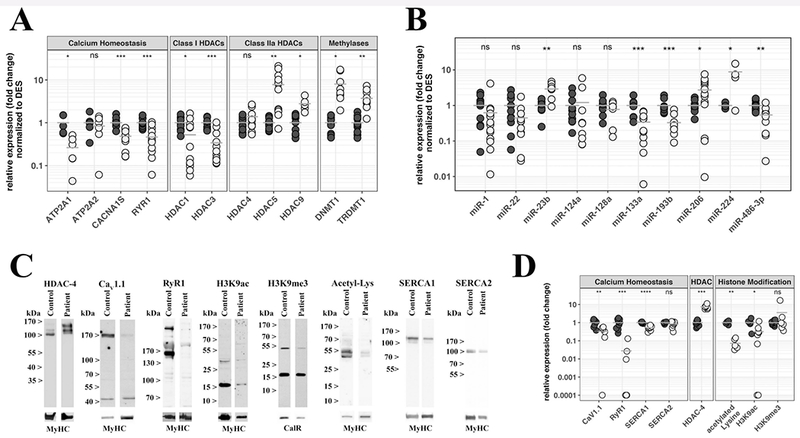
Figure 3: Muscles from SELENON patients show significant changes in the expression levels of transcripts and proteins involved in ECC and in epigenetic regulation.

A. Expression levels of the indicated transcripts were determined by qPCR and normalized to the expression of DES. B. Expression levels of the indicated miRs were determined by qPCR and normalized to RNU44. Each reaction was performed in duplicate on muscle biopsies from healthy controls (black circles) and SELENON patients (empty circles). C. Western blot analysis and protein quantification of selected proteins. Top lanes, representative immunoblots probed with the indicated antibodies. Lower lanes show immunoreactivity to an antibody recognizing all MyHC isoform or the ER protein calreticulin used to normalize for protein loading. D. Comparison of the relative expression of the indicated proteins in muscle extracts from healthy controls (black circles), and SELENON patients (empty circles). Results were prepared using Excel’s “Conditional Formatting Plugin”. The relative protein content in patients was compared to that found in healthy controls that was set to 1. The horizontal grey bar represents the mean content levels in patient muscles. *P<0.05; **P<0.01; ***P<0.001; ****P< 0.0001 Student’s t test.
