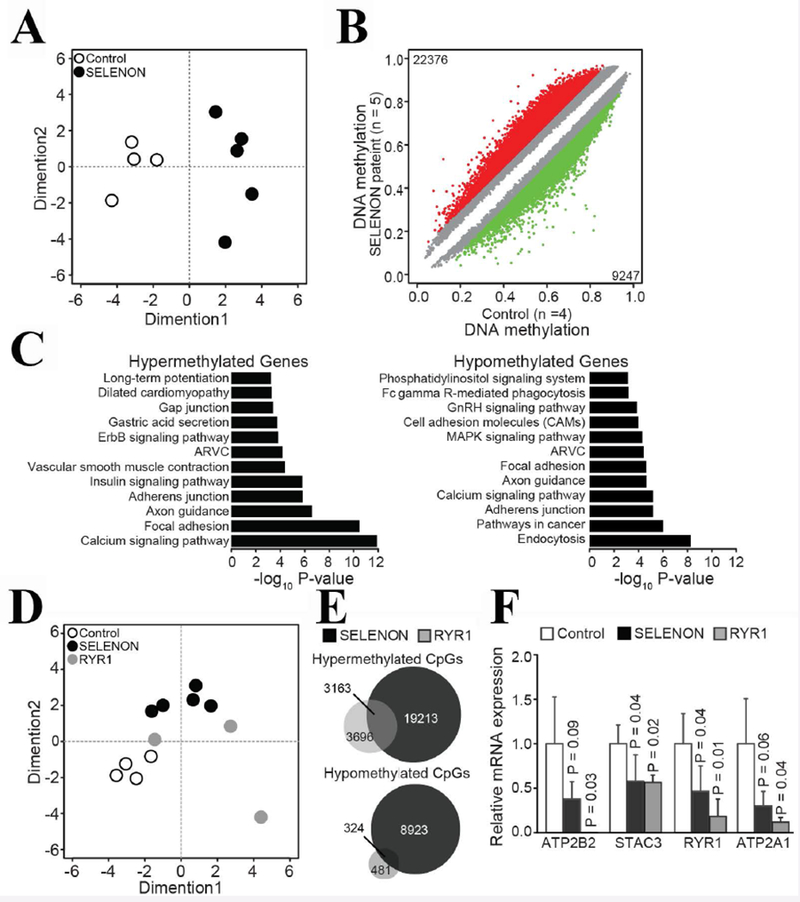
Figure 4: Muscles of patients with congenital myopathies leading to reduced RyR1 content show common changes in CpG methylation.

A. Multidimensional Scaling (MDS) plot analysis of genome-wide methylation profiles separated healthy control © muscle sample from patients with SELENON myopathy. MDS plot includes all probes on the array. B. Scatter plot shows differential methylated CpGs in patients with SELENON myopathy. Colored dots represent significant hypomethylated (green) or hypermethylated (red) CpGs together with numbers. Number of samples are indicated with n. C. Enriched KEGG pathways (P<0.001) within hypermethylated or hypomethylated CpGs associated genes. D MDS plot including controls, SELENON and RYR1 samples. E. Venn diagram shows overlap of CpGs hypermethylated in SELENON and RYR1 samples. F. qPCR analysis of selected transcripts. The ATP2B2 expression level in patients with recessive RYR1 mutations was below the detection level. The genes encoding these transcripts were hypermethylated in patients’ muscles. Results are presented as relative expression compared to control. P-values were calculated with Welch two sample t-test and error bars denote S.D.
