Figure 3.
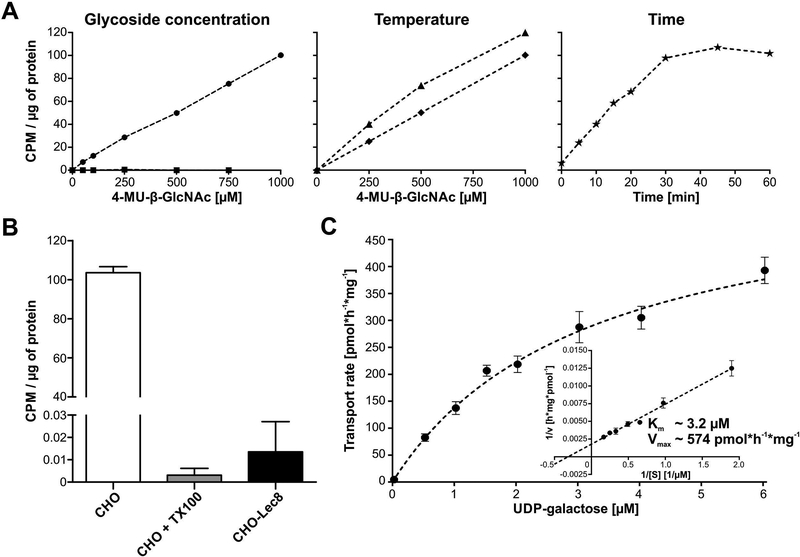
Optimization of the glycoside-based UDP-galactose transport assay. (A) GlcNAcβ−4-MU concentration, temperature and time of the assay were optimized. Glycoside concentration was tested using CHO (circles) and CHO-Lec8 (squares) cells. Temperature and time were optimized only on CHO lines. Transport efficiency at room temperature (diamonds) and 37 °C (triangles) was compared using increasing concentrations of GlcNAcβ−4-MU. Time curve (asterisk) was assayed at 37°C with 1 mM glycoside. (B) UDP-galactose transport was measured in CHO cells using optimized conditions. As a negative control CHO-Lec8 cells were employed. Specificity of the assay was determined by treating CHO cells with 0.025% Trition-X100 (CHO + TX100). The assay was performed in three biological repetitions. Error bars represent SD (C) Michaelis constant and the maximum UDP-galactose transport velocity were determined for CHO protein in optimized assay conditions. Each point represents a mean of 3 to 6 independent biological repetitions using different cell preparations and performed on different days. Error bars represents SEM. CPM – Counts Per Minute

