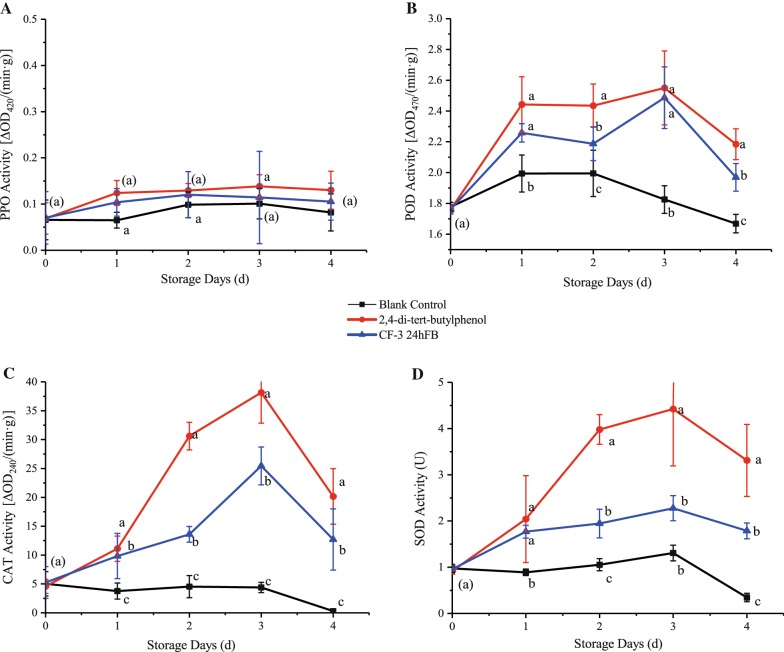
Fig. 6.
Influence of different treatments on POD (A), PPO (B), CAT (C) and SOD (D) activity in vivo during storage. The mean and standard errors in the figure were taken from three replicates, and different letters indicate that different treatments in the same storage days were significantly different (P < 0.05) (POD peroxidase, PPO polyphenol oxidase, CAT catalase, SOD superoxide dismutase)

