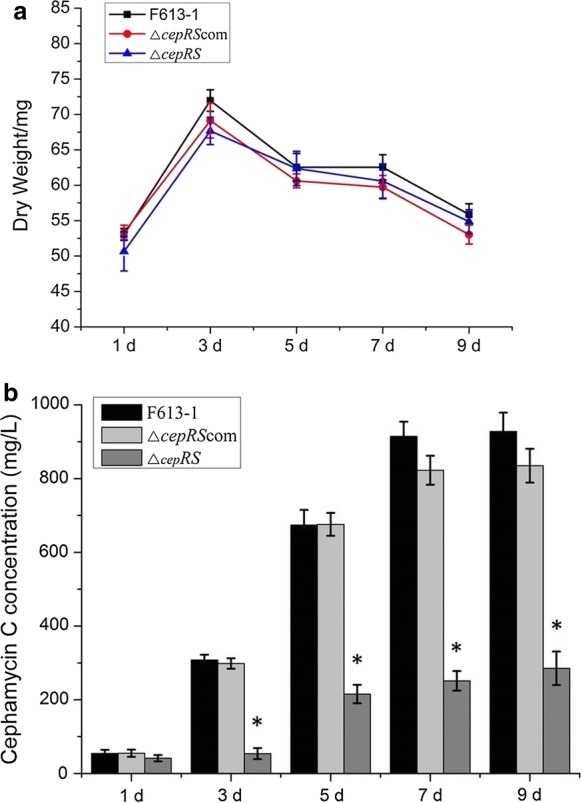
Fig. 2.

Biomass and cephamycin C concentration analyses of Streptomyces clavuligerus strains F613-1, ΔcepRS, and ΔcepRScom on TSA medium. a Growth curves of strains F613-1, ΔcepRS, and ΔcepRScom grown on TSA plates. Samples for biomass analysis were harvested at days 1, 3, 5, 7, and 9 post-inoculation. Data are the mean ± standard deviation of three separate experiments. b Concentrations of cephamycin C produced by S. clavuligerus strains F613-1, ΔcepRS, and ΔcepRScom strains. *Statistically significant difference (P < 0.05) between ΔcepRS and F613-1 at the same time point
