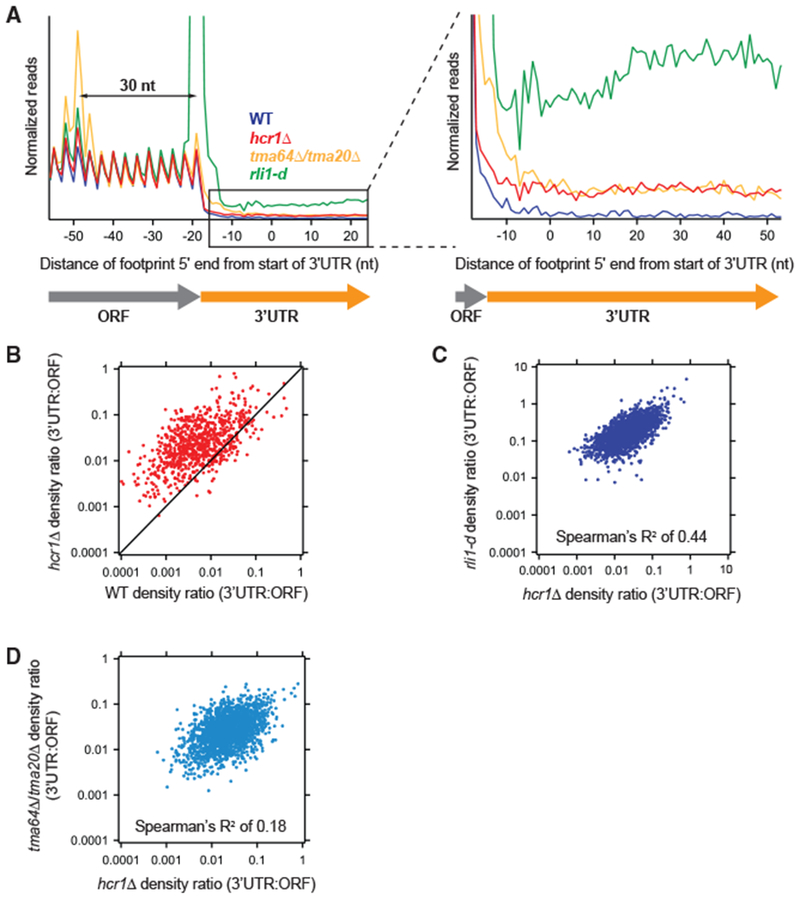
Figure 1. HCR1 Deletion Results in Increased 3′ UTR Ribosome Occupancy.

(A) Normalized average ribosome footprint occupancy (equally weighted by reads within the ORF) for all genes aligned at their stop codons. Footprints plotted by 5′ ends. (Inset) Magnified view of (A), showing increased 3′ UTR ribosome occupancy in the hcr1Δ strain relative to WT.
(B) Ratio of footprint densities in 3′ UTRs to their respective ORFs plotted for hcrlΔ. versus WT cells. Each point represents the data for one gene and shows increased 3′ UTR ribosome occupancy for most genes in the hcrlΔ. strain (most dots above the diagonal).
(C and D) Correlation analysis of ratio of footprint densities in 3′ UTRs to their respective ORFs plotted for hcrlΔ versus either rli1-d (C) or tma64Δ/20Δ. (D) cells, showing that transcripts with increased 3′ UTR ribosome occupancy are better correlated between hcr1Δ and rli1-d cells compared with the correlation between hcrlΔ. and tma64Δ/tma20Δ. cells.
Reads were pooled from the two hcrlΔ. replicates. Data for rli1-d and tma64Δ/20Δ. were taken from previous publications (described in Table S3). These datasets are created from pooled replicates that have each been shown previously to significantly differ from WT controls (Young et al., 2015, 2018). Footprint reads in (B)–(D) were quantitated by shifting them by 13 nt and then counting reads in ORFs and 3′ UTRs. Reads in the first and last 15 nt of ORFs were excluded and 3′ UTRs were extended by 25 nt to ensure collection of reads mapping partially in poly(A) tails.
