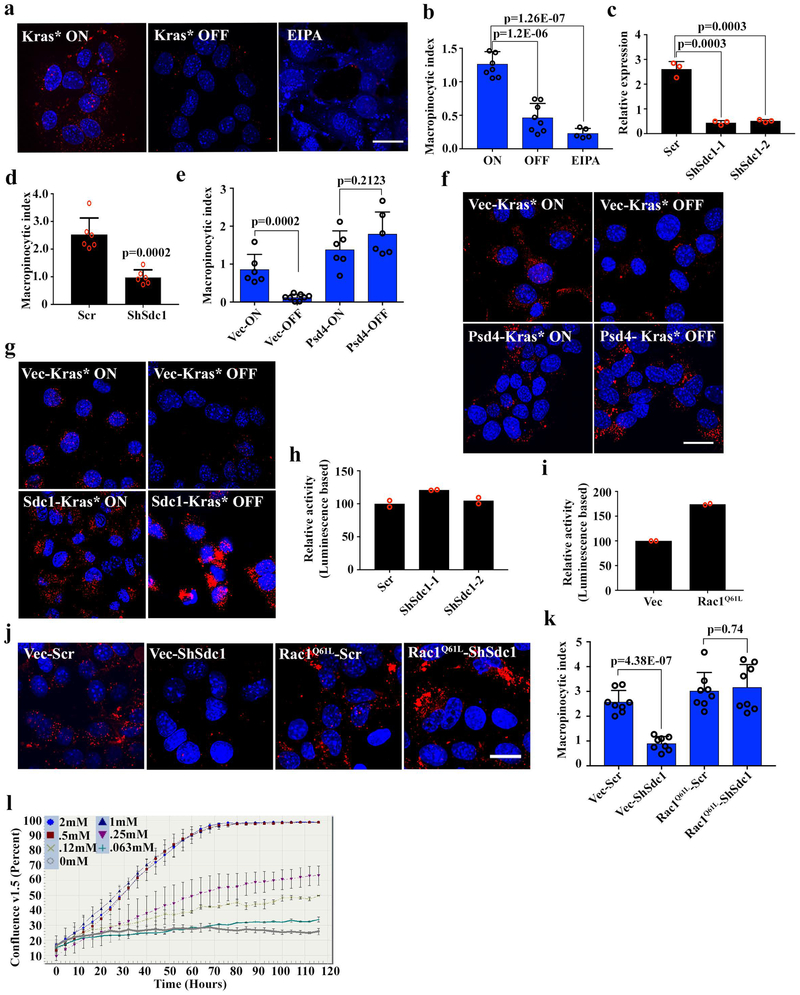
Extended Data Figure 8. SDC1 mediates macropinocytosis in KRAS*-driven mouse PDAC cells.
a-b, iKras p53L/+ tumor cells were grown in the presence (ON) or absence (OFF) of doxycycline for 24 hours. For a positive control, cells grown in the presence of doxycycline were treated with EIPA (50 μM) for 16 hours. Macropinocytosis was visualized with TMR-dextran (scale bar: 20 μm) (a) and quantified (b) (n=8 random areas for ON/OFF groups and n=5 for EIPA group; data are mean + s.d.). Data are representative of three independent experiments with similar results.
c, Validation of Sdc1 knocking down by qPCR in iKras p53L/+ tumor cells (n=3; data are mean + s.d.).
d, Macropinocytosis index in LSL-Kras p53L/+ tumor cells harboring scrambled (Scr) shRNA or shRNA against Sdc (n=6 random areas; data are mean + s.d.).
e-f, iKras p53L/+ tumor cells stably expressing Psd4 or empty vector (Vec) were grown in the presence (ON) or absence (OFF) of doxycycline for 48 hours. Macropinocytosis was visualized with TMR-dextran (scale bar: 20 μm) and quantified (n=6 random areas for Vec-ON, Psd4-ON and Psd4-OFF groups and n=8 for Vec-OFF group; data are mean + s.d.). Data are representative of two independent experiments with similar results.
g, iKras p53L/+ tumor cells stably expressing Sdc1 or empty vector (Vec) were grown in the presence (Kras* ON) or absence (Kras* OFF) of doxycycline for 48 hours. Macropinocytosis was visualized with TMR-dextran (scale bar: 20 μm). Experiments were repeated twice with similar results.
h, RhoA activity of iKras p53L/+ tumor cells harboring scrambled (Scr) shRNA or shRNA against Sdc1 was measured with G-LISA activation assay (n=2 biological replicates; data are mean + s.d.).
i, Rac1 activity in iKras p53L/+ tumor cells harboring Rac1Q61L or empty vector (Vec) was measured with G-LISA activation assay (n=2 biological replicates; data are mean + s.d.).
j-k, iKras p53L/+ tumor cells stably expressing Rac1Q61L or its empty vector were infected with scrambled (Scr) shRNA or shRNA against Sdc1. Macropinocytosis was visualized with TMR-dextran (scale bar: 20 μm) (j) and quantified (k) (n=8 random areas; data are mean + s.d.). Data are representative of two independent experiments with similar results.
l, iKras p53L/+ tumor cells were cultured in medium with serial concentrations of glutamine. Growth rate was measured and the timelapse graph was generated by Incucyte Live Cell Analysis System (n=3 technical replicates; data are mean + s.d.). Data is representative of two independent experiments with similar results.

