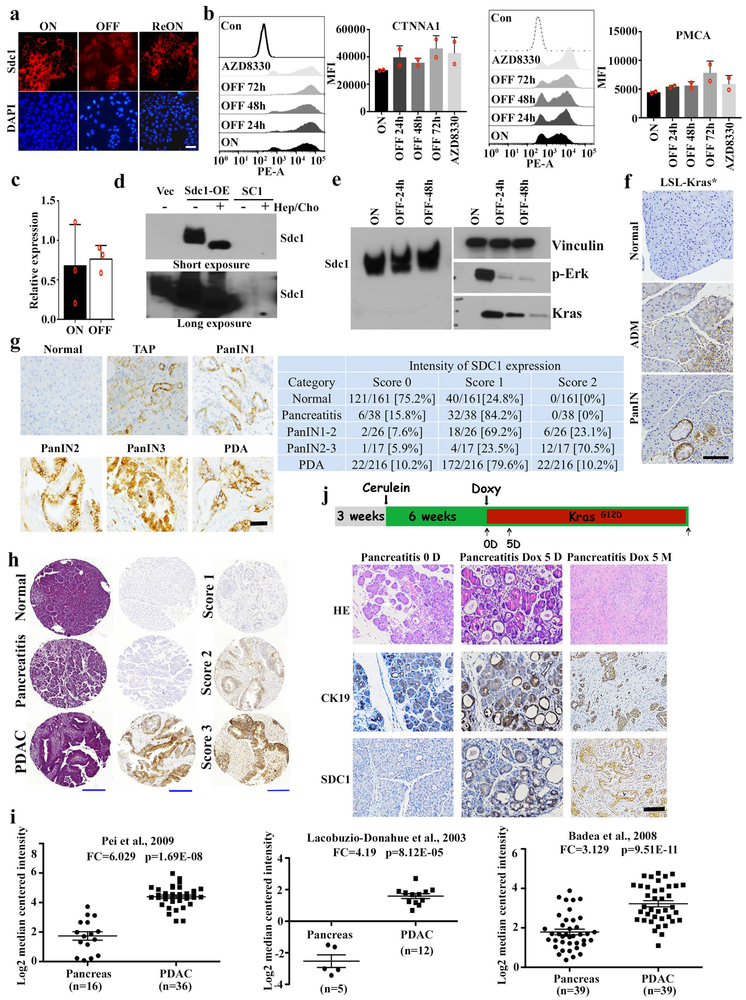
Extended Data Figure 3. SDC1 membrane expression is elevated in KRAS*-driven PDAC.
a, iKras p53L/+ tumor cells were grown in the presence (ON) or absence (OFF) of doxycycline for 48 hours and subjected to IF staining for SDC1 (red) and DAPI (blue) (scale bar: 20 μm). For REON sample, cells were grown in the absence of doxycycline for 48 hours followed by doxycycline treatment for 24 hours. Representative images were shown, which were repeated three times with similar results.
b, iKras p53L/+ tumor cells were grown in the presence (ON) or absence (OFF) of doxycycline for indicated time periods or treated with MEK inhibitor (AZD8330, 100nM) for 16-18 hours and surface protein levels of CTNNA1 and PMCA were measured by FACS analysis. The quantification of fluorescence intensity is shown. Representative figures and data from biological duplicates are shown.
c, iKras p53L/+ tumor cells were grown in the presence (ON) or absence (OFF) of doxycycline for 24 hours and Sdc1 mRNA level was measured with qPCR (n=3, Data are mean + s.d.). Experiments were repeated twice with similar results.
d, iKras p53L/+ tumor cells stably overexpressing Sdc1 (Sdc1-OE) or empty vector (Vec) and a stable single clone with double nickase-mediated Sdc1 deletion (SC1) derived from iKras p53L/+ tumor cells were blotted to validate SDC1 expression. Some samples were also treated with heparinase (Hepa) and chondroitinase (Cho) before Western blot analysis. Experiments were repeated twice with similar results.
e, iKras p53L/+ tumor cells grown in the presence (ON) or absence (OFF) of doxycycline for indicated time periods were processed for Western blot analysis to detect Sdc1, Vinculin, p-Erk and Kras. Experiments were repeated twice with similar results.
f, Representative IHC images of SDC1 staining from the LSL-Kras PDAC mouse model showing membrane Sdc1 level in normal pancreas, acinar-to-ductal metaplasia (ADM), and PanIN. Experiments were repeated twice with similar results. Scale bar: 200 μm.
g, Representative IHC images of SDC1 staining (lef) in normal pancreas, tumor adjacent pancreatitis (TAP), PanINs and invasive tumors (PDA) from the human PDAC TMA. Quantification of the TMA scores is shown in the right panel. Scale bar: 50 μm.
h, Representative HE and IHC images of SDC1 staining from the TMA analysis. Representative images of SDC1 IHC showing staining classified as low (Score 1), intermediate (Score 2) and high (Score 3). Scale bar: 200 μm.
i, mRNA expression of SDC1 in public microarray datasets. Data are mean ± s.d.; P-values were determined by unpaired two-sided Student’s t-test.
j, Outline of experimental design for sequential cerulein and doxycycline treatment in iKras* mice (Top). Chronic pancreatitis was induced in iKras* mice with cerulein injection for 6 weeks. The animals were then treated with doxycycline for indicated times. Pancreatic or tumor tissues were subjected to HE or IHC staining for CK19 and SDC1 (scale bar: 100 μm) (Bottom). Experiments were repeated twice with similar results.

