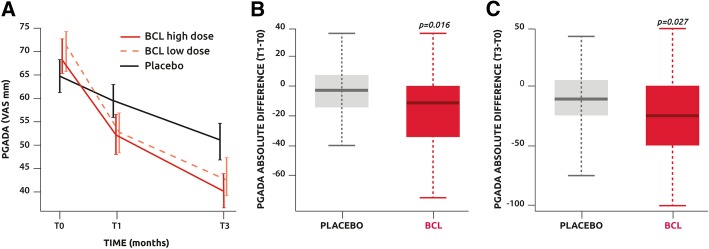
Fig. 2.
a Patients Global Assessment of Disease Activity (PGADA) assessed with a VAS evolution with time. b Comparison of the absolute difference of PGADA between T0 and T1 in the placebo and pooled low- and high-dose BCL groups. c Comparison of the absolute difference of PGDA between T0 and T3 in the placebo and pooled low- and high-dose BCL groups

