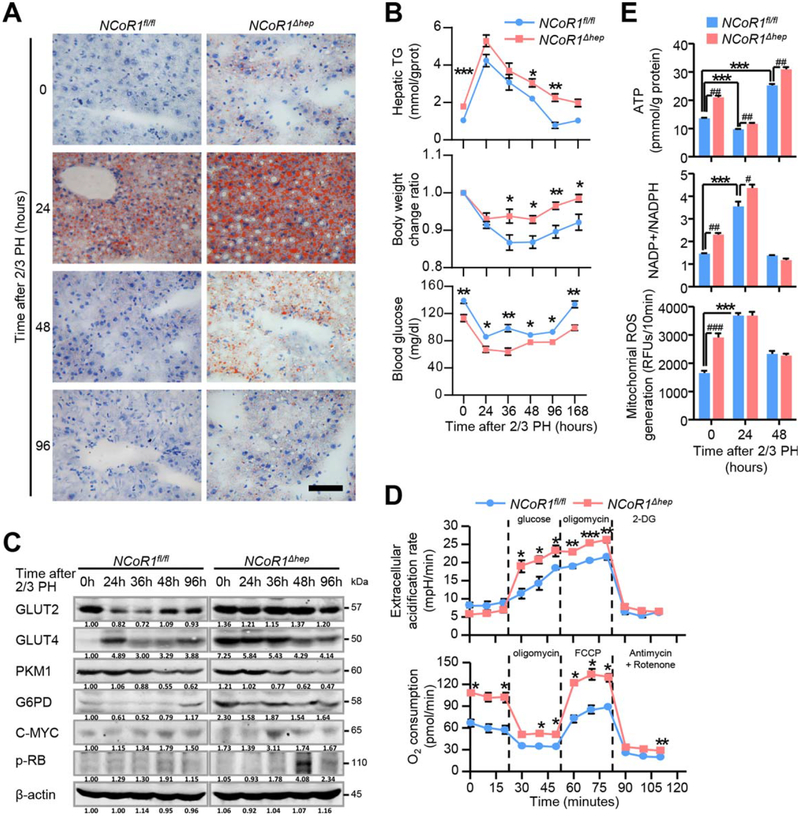
FIG. 3.
Enhanced glucose flux, mitochondrial function and de novo FAS genesis in NCoR1Δhep mice at the early stages of liver regeneration after 2/3 PH. (A) Analysis of the lipids by Oil Red O staining performed with frozen liver sections. scale bar: 50 μm (B) Analysis of liver triglyceride (TG) contents, body weight change ratios and serum glucose in NCoR1fl/fl and NCoR1Δhep mice at the indicated time points after 2/3 PH. Data are presented as mean ± SEM (n=5). The different degrees of significance were indicated as follows in the graphs: *P<0.05; **P<0.01, NCoR1Δhep mice compared to NCoR1fl/fl mice. (C) Western blot analysis of expression change of protein level of GLUT2, GLUT4, PKM1, G6PD, C-MYC and p-RB at the indicated time points after PH. (D) Upper panel: Extracellular acidification rate (ECAR) of NCoR1fl/fl and NCoR1Δhep primary hepatocytes, as measured by the Seahorse Analyzer (n = 4 each). Addition of glucose induces glycolysis-dependent lactic acid production and ECAR. Oligomycin then induces maximal ECAR, and 2-DG partially inhibits glycolysis-dependent ECAR. Lower panel: Oxygen consumption rate (OCR) of NCoR1fl/fl and NCoR1Δhep primary hepatocytes, as measured by the Seahorse Analyzer (n = 4 each). Oligomycin treatment inhibits ATP synthase dependent OCR. The proton gradient uncoupler FCCP then induces maximal OCR, and antimycin/rotenone finally inhibits all OxPhos-dependent OCR. *P<0.05; **P<0.01, ***P<0.001, NCoR1 KO hepatocyte compared to NCoR1fl/fl hepatocyte. (E) Biochemical detection of intracellular ATP levels, NADP+/NADPH ratios and mitochondrial ROS in NCoR1fl/fl and NCoR1Δhep mice at the indicated times after 2/3 PH. Data are presented as mean ± SEM (n=4). The different degrees of significance were indicated as follows in the graphs: *P<0.05; **P<0.01; ***P<0.001, NCoR1fl/fl mice at 0 hours compared with NCoR1fl/fl mice at indicated times after 2/3 PH. #P<0.05; ##P<0.01, ###P<0.001, NCoR1Δhep mice compared to NCoR1fl/fl mice at indicated times after 2/3 PH. (Two Way ANOVA plus Student’s t test for B, D; Student’s t test for E).

