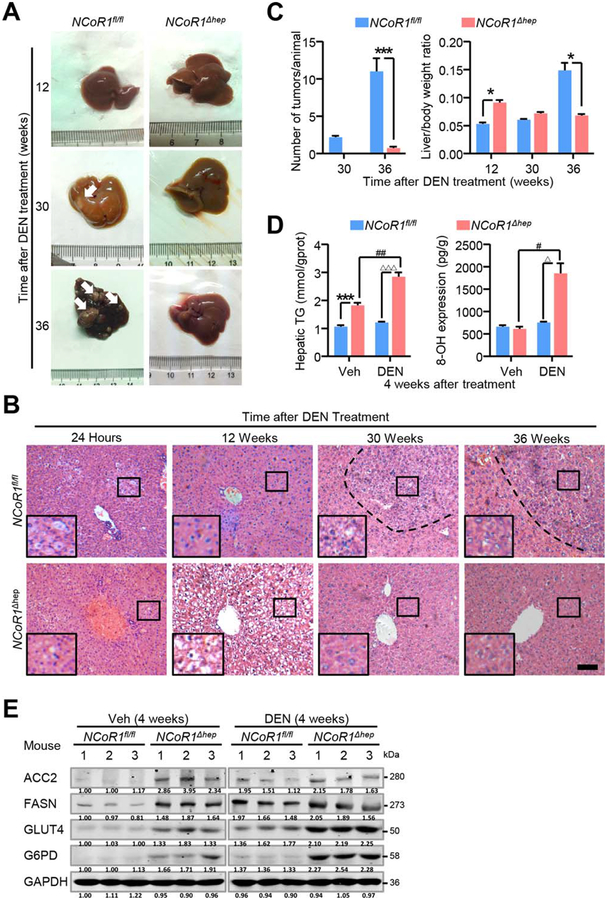
FIG. 5.
Attenuated formation of DEN-induced tumors in NCoR1Δhep mice. (A) NCoR1fl/fl and NCoR1Δhep mice were intraperitoneally injected with PBS or DEN at day 15 after born and livers collected at 24 hours after injection and 4, 12, 30, 36 weeks after injection. Representative images and (B) representative H&E histological features of livers from DEN-treated mice at the indicated times after killing were shown. scale bar: 100 μm. (C) Quantification of the number of macroscopic tumors per animal and analysis of the liver to body weight ratio of NCoR1fl/fl and NCoR1Δhep mice. Data are presented as mean ± SEM (n=5). The different degrees of significance are indicated as follows in the graphs: *P<0.05; ***P<0.001, NCoR1Δhep mice compared to NCoR1fl/fl mice. (D) Biochemical detection of liver triglyceride content and 8-OhDG (8-OH) in NCoR1fl/fl and NCoR1Δhep mice treated with PBS or DEN at four weeks after injection. Data are presented as mean ± SEM (n=4). ***P<0.001, NCoR1Δhep mice compared to NCoR1fl/fl mice treated with Veh. #P<0.05; ##P<0.01 NCoR1Δhep mice treated with Veh compared to NCoR1Δhep mice treated with DEN. ΔΔΔP<0.001, NCoR1fl/fl mice treated with DEN compared to NCoR1Δhep mice treated with DEN. (E) Western blot analysis of expression of protein level of ACC2, GLUT4, FASN, G6PD in NCoR1fl/fl and NCoR1Δhep mice treated with PBS or DEN at four weeks after DEN treatment. (Student’s t test for B, D).

