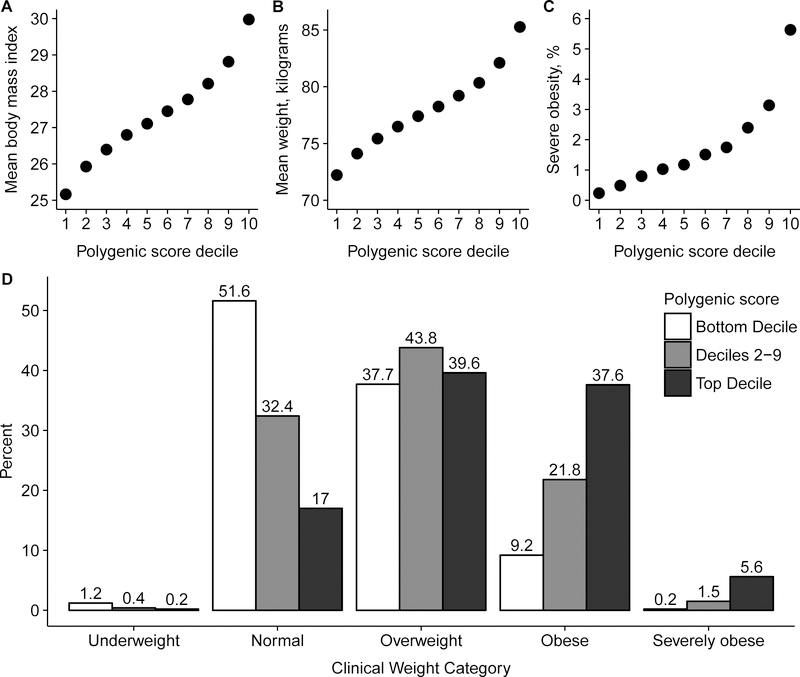
Figure 2. Relationship of genome-wide polygenic score distribution with body mass index, weight, and severe obesity.
288,016 middle-aged UK Biobank participants were binned into 10 deciles according to the polygenic score. Body mass index (Panel A), weight (Panel B), and prevalence of severe obesity (Panel C) each increased across deciles of the polygenic score (p < 0.0001 for each). Significant differences in clinical categories of obesity were noted (Panel D) when participants were stratified into three categories – bottom decile, deciles 2–9, and top decile. Underweight refers to BMI < 18.5 kg/m2, normal as 18.5 to 24.9 kg/m2, overweight as 25.0 to 29.9 kg/m2, obesity as 30.0 to 39.9 kg/m2, and severe obesity as ≥ 40 kg/m2 (NHLBI Expert Panel, 1998). See also Figures S1, S2, and S3.

